Image


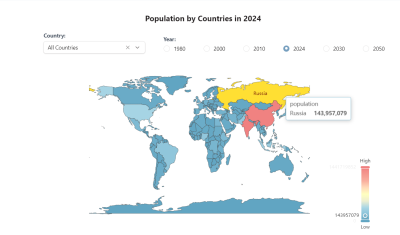
Appsmith's native chart widget is easy to use and supports most common chart types, like bar, line, column, area and pie charts. And for more advanced charting options, echarts can also be used by selecting the custom echarts option, and providing a chart config following the echarts format.
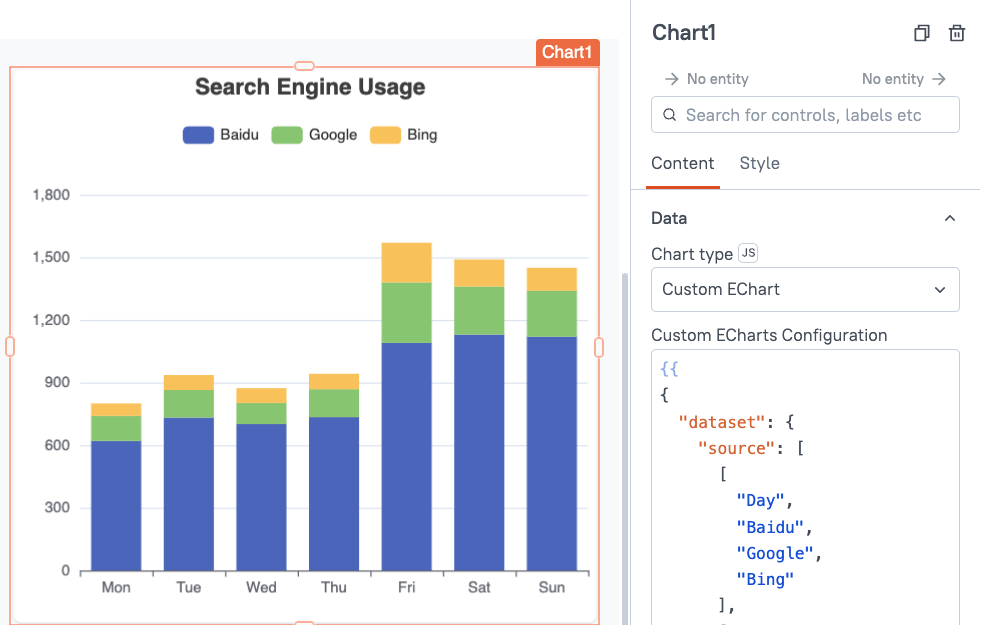
Apache ECharts is a powerful, interactive charting and data visualization library that runs in the browser.
Check out their extensive example library here:
https://echarts.apache.org/examples/en/index.html
These examples can easily be modified to run in Appsmith's chart widget by following theses guides:
