How to Pass Dynamic Variables to Custom Widgets in Appsmith?

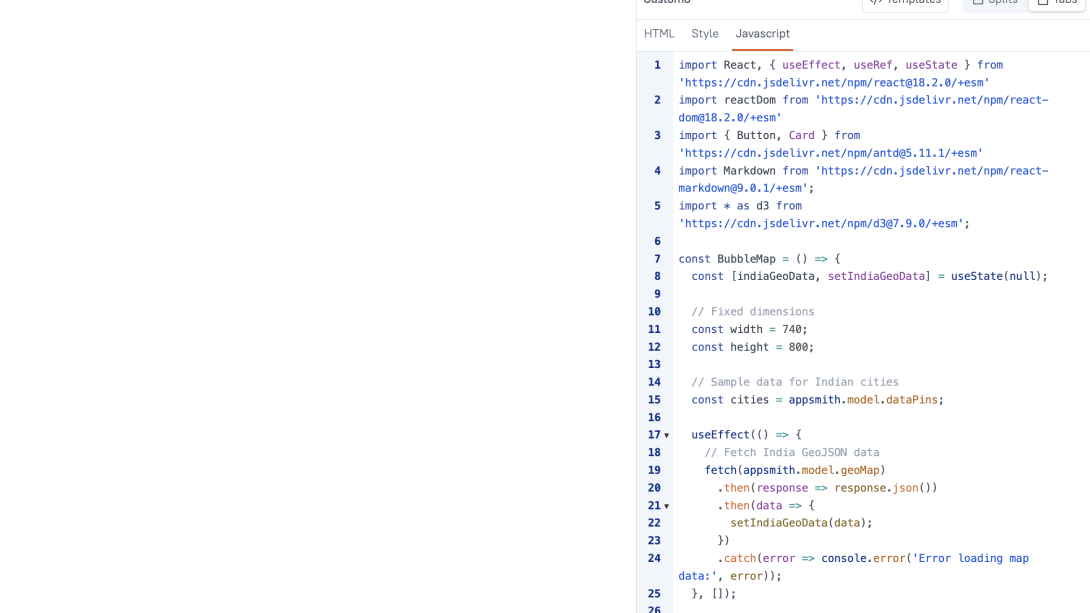
Like mentioned earlier. This is the custom widget code:
```
import React, { useEffect, useRef, useState } from 'https://cdn.jsdelivr.net/npm/react@18.2.0/+esm'
import reactDom from 'https://cdn.jsdelivr.net/npm/react-dom@18.2.0/+esm'
import { Button, Card } from 'https://cdn.jsdelivr.net/npm/antd@5.11.1/+esm'
import Markdown from 'https://cdn.jsdelivr.net/npm/react-markdown@9.0.1/+esm';
import * as d3 from 'https://cdn.jsdelivr.net/npm/d3@7.9.0/+esm';
const BubbleMap = () => {
const [indiaGeoData, setIndiaGeoData] = useState(null);
// Fixed dimensions
const width = 740;
const height = 800;
// Sample data for Indian cities
const cities = appsmith.model.dataPins;
useEffect(() => {
// Fetch India GeoJSON data
fetch(appsmith.model.geoMap)
.then(response => response.json())
.then(data => {
setIndiaGeoData(data);
})
.catch(error => console.error('Error loading map data:', error));
}, []);
// Create the projection
const projection = d3.geoMercator()
.center(appsmith.model.geoMapCenter) // Adjusted center for India
.scale(1200)
.translate([width / 2, height / 2]);
// Create path generator
const pathGenerator = d3.geoPath().projection(projection);
// Create scales
const maxValue = 100;
const sizeScale = d3.scaleSqrt()
.domain([0, maxValue])
.range([5, 10]);
const colorScale = d3.scaleSequential().range([" #ff0000 ", "#00ff00"])
.domain([0, maxValue]);
// Project coordinates
const projectedCities = cities.map(city => {
const position = projection([city.lon, city.lat]);
return {
...city,
x: position[0],
y: position[1]
};
});
return (
<div style={{ border: '1px solid #ccc', margin: '20px', padding: '10px' }}>
<svg width={width} height={height} style={{ background: '#f0f0f0' }}>
{/* Background */}
<rect width={width} height={height} fill="#f8fafc" />
{/* India Map */}
{indiaGeoData && (
<g className="states">
{indiaGeoData.features.map((feature, i) => (
<path
key={i}
d={pathGenerator(feature)}
fill="#e5e7eb"
stroke="#cbd5e1"
strokeWidth={0.5}
/>
))}
</g>
)}
{/* Cities */}
{projectedCities.map((city, i) => (
<g key={i}>
{/* Bubble */}
<circle
cx={city.x}
cy={city.y}
r={sizeScale(city.value)}
fill={colorScale(city.value)}
opacity={0.7}
stroke="#fff"
strokeWidth={1}
/>
{/* City name */}
<text
x={city.x}
y={city.y - sizeScale(city.value) - 5}
textAnchor="middle"
fontSize="12px"
fill="#333"
fontWeight="bold"
>
{city.name}
</text>
{/* Value */}
<text
x={city.x}
y={city.y + sizeScale(city.value) + 15}
textAnchor="middle"
fontSize="10px"
fill="#666"
>
{city.value}%
</text>
</g>
))}
{/* Legend */}
<g transform={`translate(${width - 100}, ${height - 120})`}>
<text y={-10} fontSize="12px" fill="#333" fontWeight="bold">
Availability (%)
</text>
{[0, 25, 50, 75, 100].map((value, i) => (
<g key={i} transform={`translate(0,${i * 25})`}>
<circle
r={sizeScale(value)}
fill={colorScale(value)}
opacity={0.7}
stroke="#fff"
strokeWidth={1}
/>
<text x={35} y={5} fontSize="10px" fill="#666">
{value}%
</text>
</g>
))}
</g>
</svg>
</div>
);
};
function App() {
const [currentIndex, setCurrentIndex] = React.useState(0);
const handleNext = () => {
setCurrentIndex((prevIndex) => (prevIndex + 1) % appsmith.model.tips.length);
};
const handleReset = () => {
setCurrentIndex(0);
appsmith.triggerEvent("onResetClick");
};
console.log(1)
return (
<Card className="app">
<BubbleMap />
</Card>
);
}
appsmith.onReady(() => {
/*
* This handler function will get called when parent application is ready.
* Initialize your component here
* more info - https://docs.appsmith.com/reference/widgets/custom#onready
*/
reactDom.render(<App />, document.getElementById("root"));
});
```
Now, in the above case, I have external query which fetch the data for the data pins to be shown to the users. The variable name being dataPins. So, whenever the required filters are selected, the query is run and I want to the data to pass into the graph to plot it accordingly.
I couldn't find any way to do this in the custom widget. Can someone please help? Or should I use a different way to do this?