

Revolutionizing Business Intelligence with Appsmith and Neon
Goal
At the end of this article you will learn how to revolutionize business intelligence by combining the power of Appsmith, the ultimate no-code and low-code platform, with Neon, the fully managed multi-cloud serverless Postgres solution.
Shortcut : 10 minutes is quick and easy, but if you want to see, use, or fork my version, here it is.
Prerequisites
A Neon Platform Account (free)
An Appsmith Account.
Overview
Recently, Appsmith took center stage at the Neon Developer Days, an event that brought together developer experts, advocates, and partner companies to unveil the remarkable synergy between Neon's Cloud PostgreSQL platform and other third-party applications, in our case, Appsmith's revolutionary application-building capabilities.
Appsmith, a leading player in the realm of no-code and low-code application development, offers a unique proposition: the ability to create rich, interactive dashboards and data-driven applications without the need for extensive coding. It's not just an efficient tool; it's the ultimate solution for crafting custom, internal tools that empower businesses to streamline processes, monitor data, and make well-informed decisions.
Imagine creating internal tools and dashboards with ease, automating critical business operations, and making data-driven decisions in minutes. Appsmith has been a game-changer for SaaS and Enterprise companies, maximizing engineering velocity and minimizing costs.. In this article, we will delve into one example use case that we showcased during the event.
We've prepared a demo application that showcases audience intelligence data from a fictional TV network channel. Through this demo, you will witness the power of Appsmith's no-code and low-code capabilities combined with Neon's robust database services. We'll build an audience dashboard that will provide insights into our viewership, demonstrating how businesses can leverage this to make data-driven decisions.
Create the PostgreSQL Neon Database
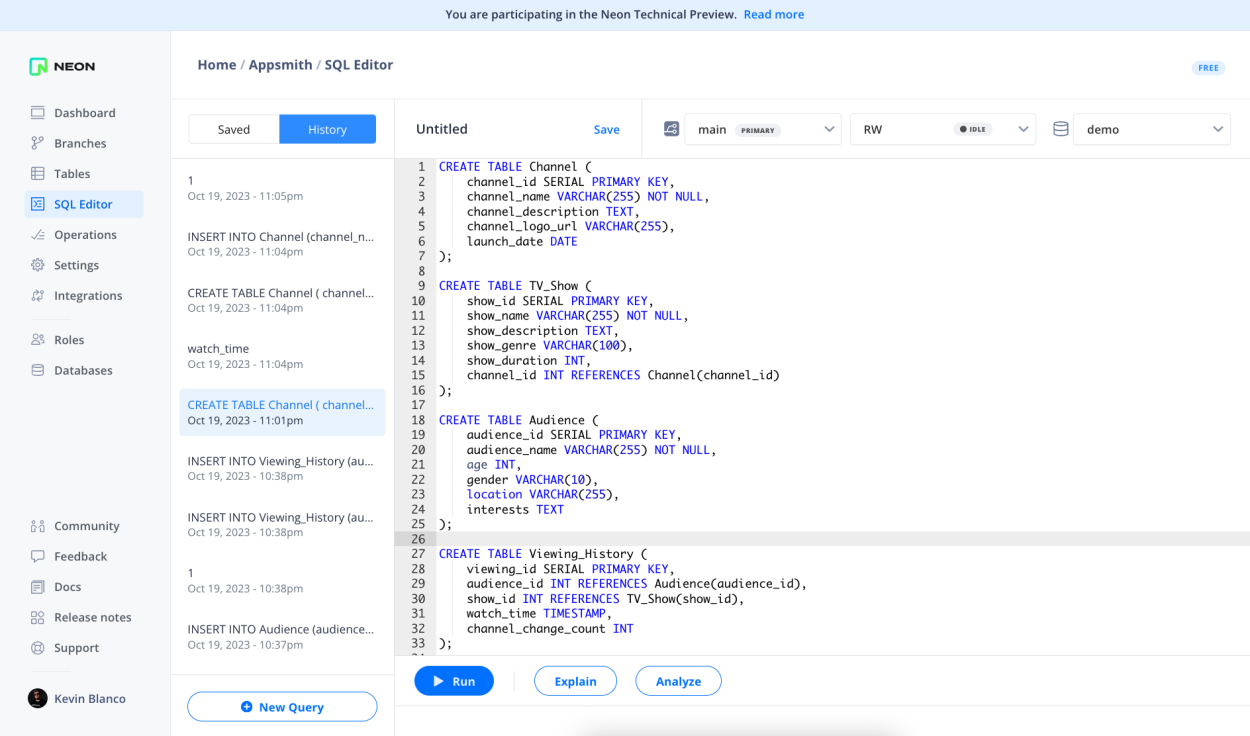
To build this intelligence app that displays audience intelligence data from a TV network channel, we'll need a database structure that can store and organize the necessary information. Below is a set of tables and their relationships to support this use case that I easily created in Neon using the SQL Editor:
- Channel Table:
- Fields:
- channel_id (Primary Key)
- channel_name
- channel_description
- channel_logo_url
- launch_date
- Fields:
- TV Show Table:
- Fields:
- show_id (Primary Key)
- show_name
- show_description
- show_genre
- show_duration (in minutes)
- channel_id (Foreign Key referencing Channel Table)
- Fields:
- Audience Table:
- Fields:
- audience_id (Primary Key)
- audience_name
- age
- gender
- location
- interests
- Fields:
- Viewing History Table:
- Fields:
- viewing_id (Primary Key)
- audience_id (Foreign Key referencing Audience Table)
- show_id (Foreign Key referencing TV Show Table)
- watch_time (timestamp)
- channel_change_count
- Fields:
With this database structure, we can capture data about TV channels, TV shows, the audience, and their viewing history. If you want to create dummy data for testing, you can also run the following SQL queries to insert some data:
INSERT INTO Channel (channel_name, channel_description, channel_logo_url, launch_date)
VALUES
    ('Channel A', 'Entertainment Channel', 'logo_url_a.png', '2023-01-01'),
    ('Channel B', 'News Channel', 'logo_url_b.png', '2023-02-15'),
    ('Channel C', 'Sports Channel', 'logo_url_c.png', '2023-03-20'),
    ('Channel D', 'Cooking Channel', 'logo_url_d.png', '2023-04-10'),
    ('Channel E', 'Kids Channel', 'logo_url_e.png', '2023-05-05');
INSERT INTO TV_Show (show_name, show_description, show_genre, show_duration, channel_id) VALUES ('How I meet your DevRel', 'Comedy Show', 'Comedy', 30, 1), ('DevRel vs Marketing', 'Drama Show', 'Drama', 45, 1), ('The Murder of a DevRel', 'Police Show', 'Reality', 60, 1), ('The DevRel News', 'Morning News', 'News', 60, 2), ('Coffee with the DevRels', 'Evening News', 'News', 60, 2), ('Night Advocates', 'Late News', 'News', 60, 2), ('UEFA DevRel League', 'Soccer Sports', 'Sports', 60, 3), ('DevRel Woods', 'Golf Sports', 'Sports', 60, 3), ('The DevRel Bulls', 'Basketball Sports', 'Sports', 60, 3), ('Advocate Compadre', 'Mexican Food', 'Cooking', 45, 4), ('DevRel Masala', 'Indian Flavours', 'Cooking', 30, 4), ('Advocate-San Mazu', 'Japanese Food Art', 'Cooking', 60, 4), ('DevRel for Kids', 'Blue Steps', 'Kids', 45, 5), ('Playing with Marketing', 'The Alphabet', 'Kids', 30, 5), ('Paint the Avocado', 'Painting', 'Kids', 60, 5);INSERT INTO Audience (audience_name, age, gender, location, interests) SELECT 'Audience ' || generate_series(1, 50), floor(random() * 70) + 18, CASE WHEN random() < 0.5 THEN 'Male' ELSE 'Female' END, CASE floor(random() * 50) WHEN 0 THEN 'Alabama' WHEN 1 THEN 'Alaska' WHEN 2 THEN 'Arizona' WHEN 3 THEN 'Arkansas' WHEN 4 THEN 'California' WHEN 5 THEN 'Colorado' WHEN 6 THEN 'Connecticut' WHEN 7 THEN 'Delaware' WHEN 8 THEN 'Florida' WHEN 9 THEN 'Georgia' WHEN 10 THEN 'Hawaii' WHEN 11 THEN 'Idaho' WHEN 12 THEN 'Illinois' WHEN 13 THEN 'Indiana' WHEN 14 THEN 'Iowa' WHEN 15 THEN 'Kansas' WHEN 16 THEN 'Kentucky' WHEN 17 THEN 'Louisiana' WHEN 18 THEN 'Maine' WHEN 19 THEN 'Maryland' WHEN 20 THEN 'Massachusetts' WHEN 21 THEN 'Michigan' WHEN 22 THEN 'Minnesota' WHEN 23 THEN 'Mississippi' WHEN 24 THEN 'Missouri' WHEN 25 THEN 'Montana' WHEN 26 THEN 'Nebraska' WHEN 27 THEN 'Nevada' WHEN 28 THEN 'New Hampshire' WHEN 29 THEN 'New Jersey' WHEN 30 THEN 'New Mexico' WHEN 31 THEN 'New York' WHEN 32 THEN 'North Carolina' WHEN 33 THEN 'North Dakota' WHEN 34 THEN 'Ohio' WHEN 35 THEN 'Oklahoma' WHEN 36 THEN 'Oregon' WHEN 37 THEN 'Pennsylvania' WHEN 38 THEN 'Rhode Island' WHEN 39 THEN 'South Carolina' WHEN 40 THEN 'South Dakota' WHEN 41 THEN 'Tennessee' WHEN 42 THEN 'Texas' WHEN 43 THEN 'Utah' WHEN 44 THEN 'Vermont' WHEN 45 THEN 'Virginia' WHEN 46 THEN 'Washington' WHEN 47 THEN 'West Virginia' WHEN 48 THEN 'Wisconsin' ELSE 'Wyoming' END, 'Interests ' || floor(random() * 5) + 1 FROM generate_series(1, 50);INSERT INTO Viewing_History (audience_id, show_id, watch_time, channel_change_count) SELECT floor(random() * 50) + 1, 1, NOW() - (random() * interval '365 days'), floor(random() * 5) FROM generate_series(1, 200);With these queries, you will have sample test data to retrieve in Appsmith.
- Channel Table:
Create the Appsmith App
To create intelligence reports for your demo application using Appsmith, you can rely on Appsmith's intuitive and powerful Query editor to perform queries and aggregations on this data to extract meaningful insights and then passing it to UI Widgets very easily. If you don't know anything about SQL that's fine! Let's leverage Appsmith's contextual AI prompts to ask what we need.
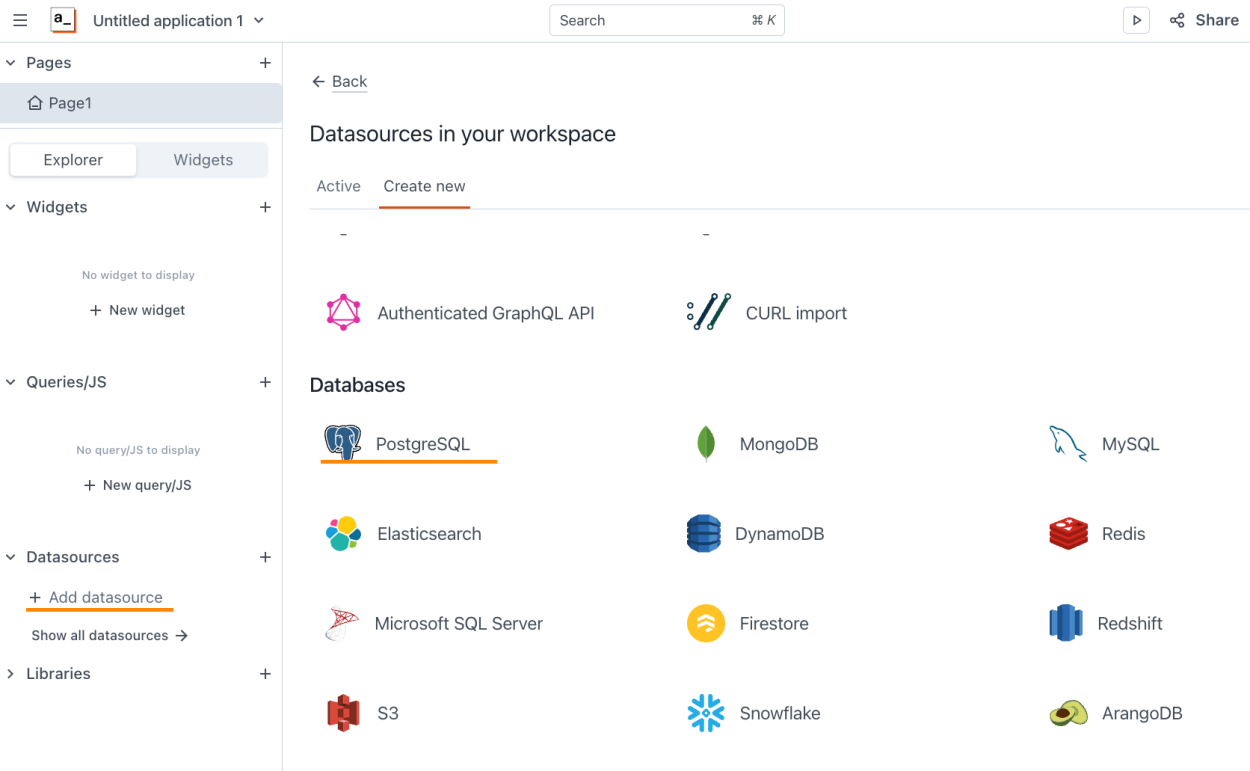
Go to Appsmith and create a new app, then grab the credentials from the Neon database dashboard and create a new Datasource in your Appsmith app:
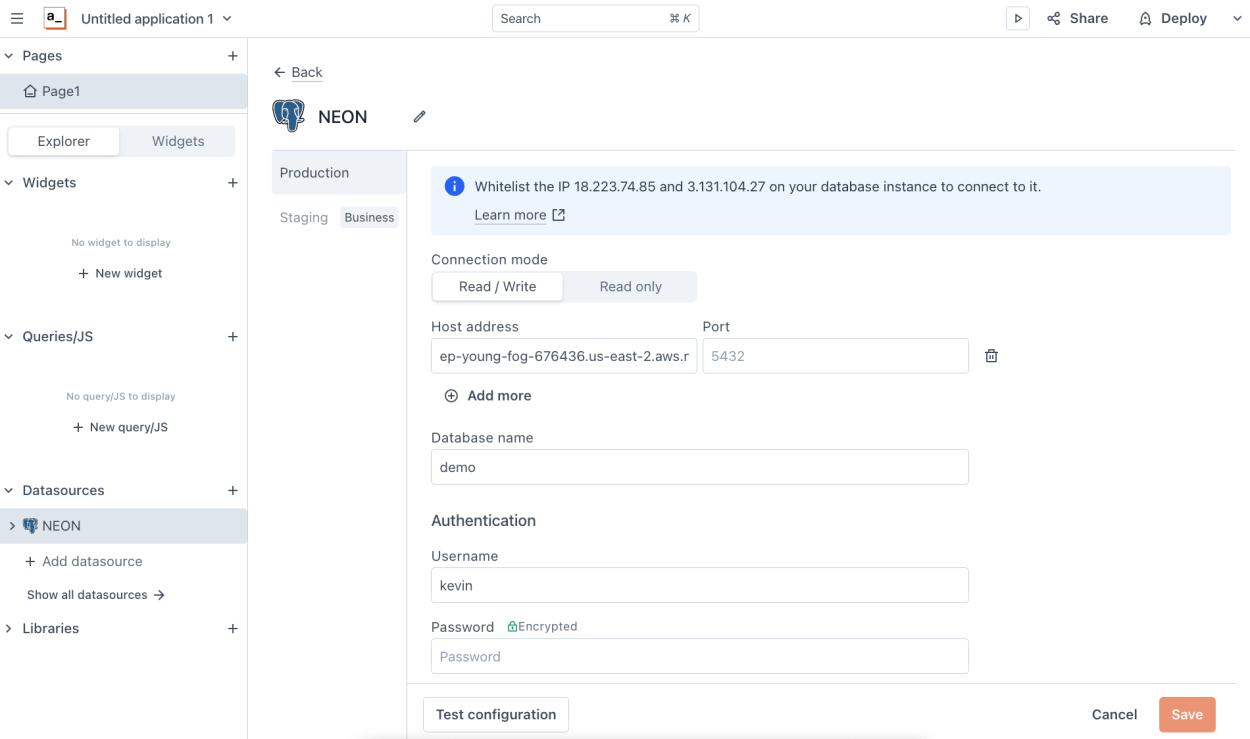
Then, enter the credentials from the Neon dashboard in the Connection fields:
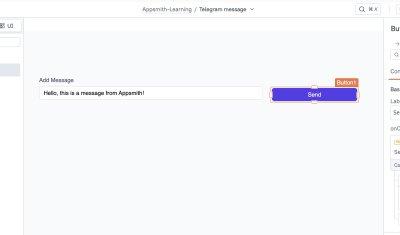
Hit save and now you are ready to start creating queries! Let's create a new query and ask AI for help building our Appsmith app, we want to showcase a chart of our audience by gender, so let's click on "Use AI" and ask for
Gender vs count of audience with that gender, Female or Maleand now Appsmith will analize our database and generate a valuable and useful working SQL query which will retrieve a count of our audience by audience.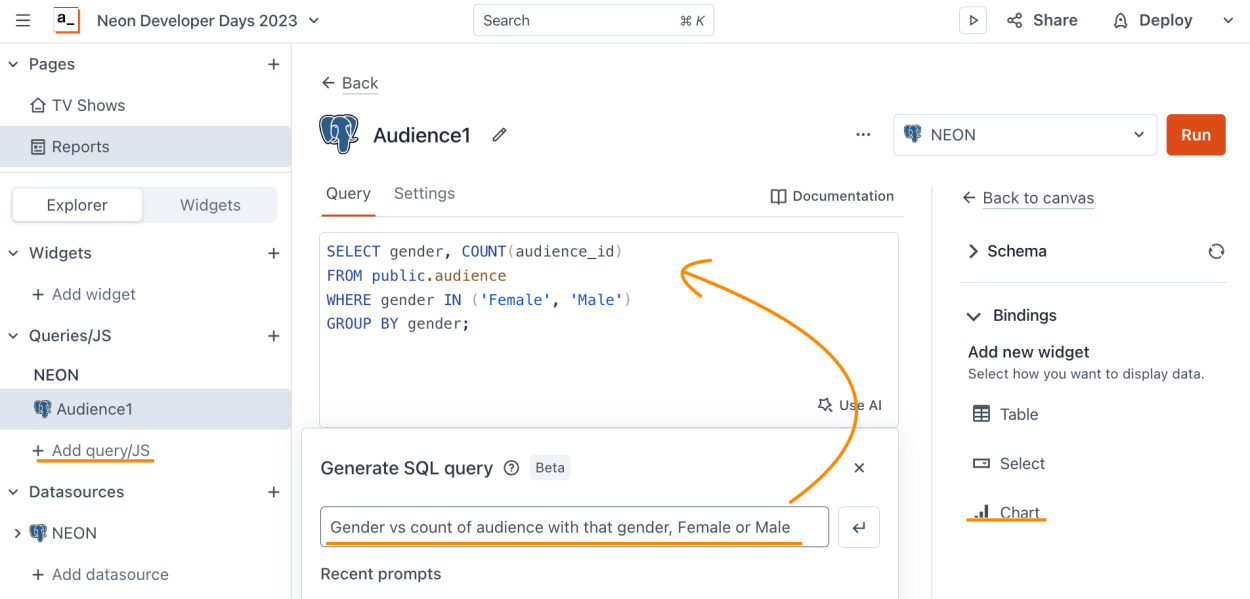
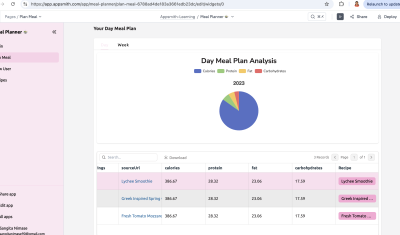
Then, you can click the "Chart" binding on the right to bind the result of this query to the UI.
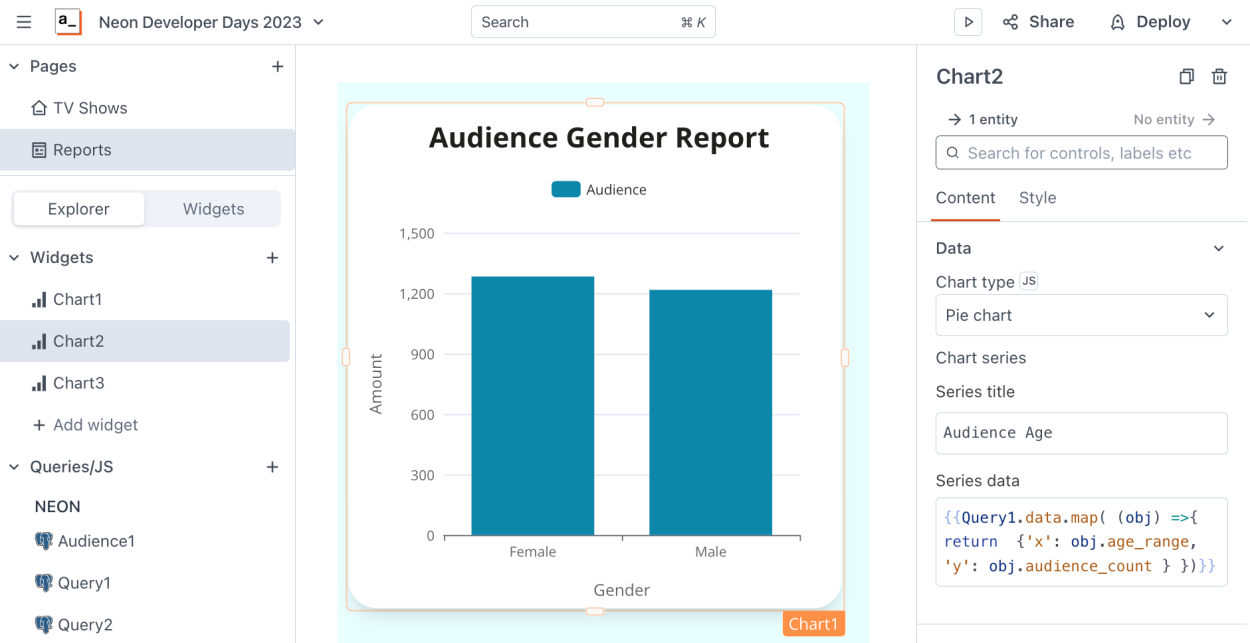
And just like that, you now have a deployable app showcasing a dashboard chart with our Audience. Now, you can continue to do the same by asking AI the following prompts:
1.
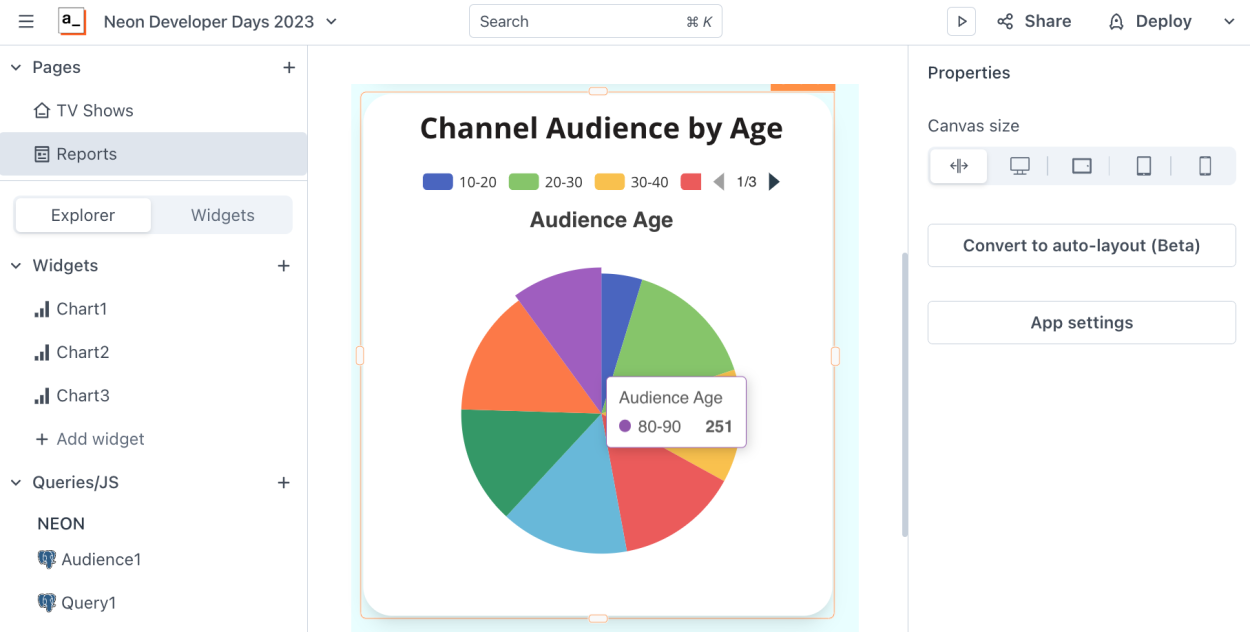
Get from the audience table age vs count of audience with that age, but group the ages by 10 year ranges, like 30-40, 40-502.
From the viewing history table, using the channel_change_count give me the amount of channel changes per show and pull the show name from the tv_shows tableWith these 2 queries, Appsmith will get the data and also bind it to Charts, and we will be able to easily showcase more valuable key-decision data in our dashboard from the Neon app.
Here are some other example queries you can easily build in your app:
- Audience Demographics:
- Calculate the number of male and female viewers in different age groups.
- Analyze the locations and interests of the audience.
- Popular Shows:
- Identify the most-watched TV shows.
- Determine the average watch time for each show.
- Channel Performance:
- Measure the number of viewers for each channel.
- Calculate the channel switch rate (channel change count).
- Audience Engagement:
- Find out the TV show that had the longest watch time per viewer.
- Identify the most popular TV show genres among the audience.
- Cross-Channel Behavior:
- Discover which channels are often viewed together and analyze the audience's cross-channel behavior.
- Audience Demographics:
Much easier, use the template
In case you do not want to build your app step by step, you can use the forkable app we have prepared in our Templates catalog, you can view/try/fork the app in the following link: https://community.appsmith.com/template/business-intelligence-template-neon-postgresql
Conclusion
We believe that the future of business intelligence and internal tooling is brighter than ever with these two platforms. If you haven't already, make sure to explore Appsmith and Neon further. Our teams are here to support you every step of the way.
Great article! The power of contextual AI is just an amazing feature!
slope 2
Interesting! I didn't think that combining Appsmith with Neon would help optimize data flow and speed up BI so much. After reading it, it opens up many new ideas for internal projects.