Gantt Charts are useful for visualizing tasks or events on a timeline, and seeing how they overlap. One popular tool for creating Gantt Charts is MermaidJS, an open source charting library with a markdown-like syntax.
In this guide, I'll be pulling data from Monday.com's GraphQL API and using it to generate a data-driven Gantt Chart. Monday already has a built-in Gantt Chart, but it's not available on the free plan, so I thought the community might enjoy this example.
Let's get charting! 📈
Monday GraphQL API
Start out by opening the Monday.com API playground for your organization. The url should be something like this:
https://{TEAM_NAME}.monday.com/apps/playgroundUse this to write your GraphQL query first, so you don't have to worry about an API key yet. You can open the docs from the left sidebar to see more details about each field and how to filter different values.
For this guide we'll be listing Tasks on a Project. Enter this in the query body:
query getTasks ($board_id: [ID!]) {
 boards(ids: $board_id) {
   name
   items_page {
     cursor
     items {
       id
       name
       column_values {
         id
         text
       }
     }
   }
 }
}
Then add the variable, inserting your board_id from the URL of the board you want to query
{
    "board_id": ["BOARD_ID"]
}
Click RUN and you should get back the items on the requested board.
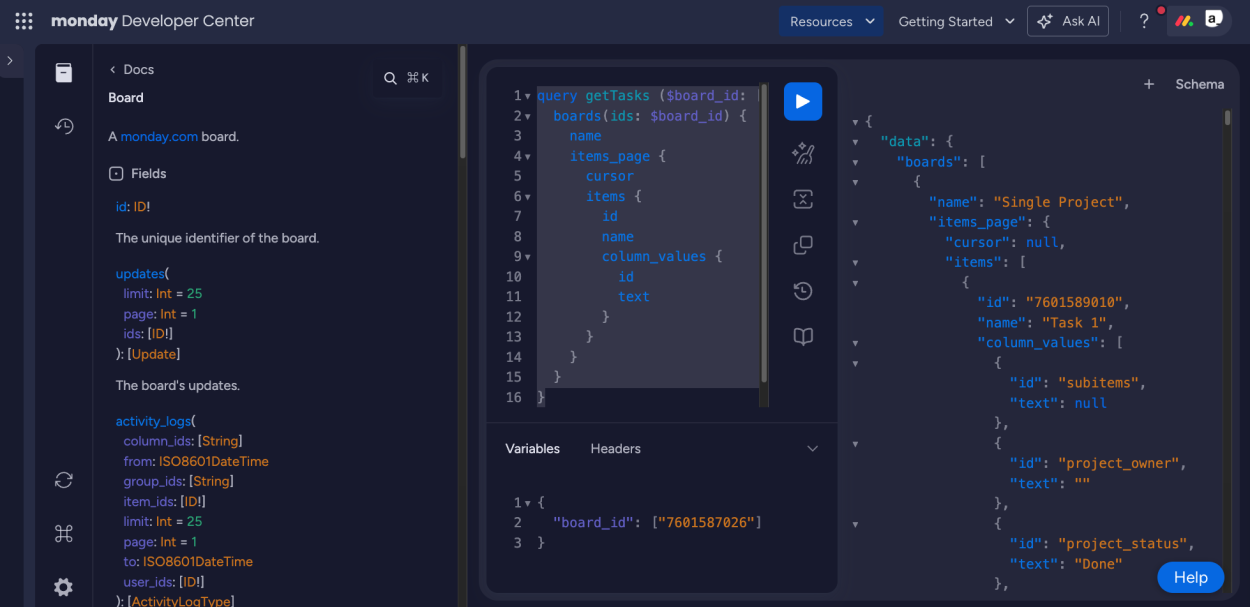
Now click My Access Tokens on the left sidebar, then click on the token to Show the value and Copy it.
Appsmith Datasource
Open the Appsmith app where you want to add a Monday.com Gantt chart, and add a new Datasource.
- Click the Data icon on the left sidebar
- Click + to add a new Datasource
- Select Authenticated GraphQL API
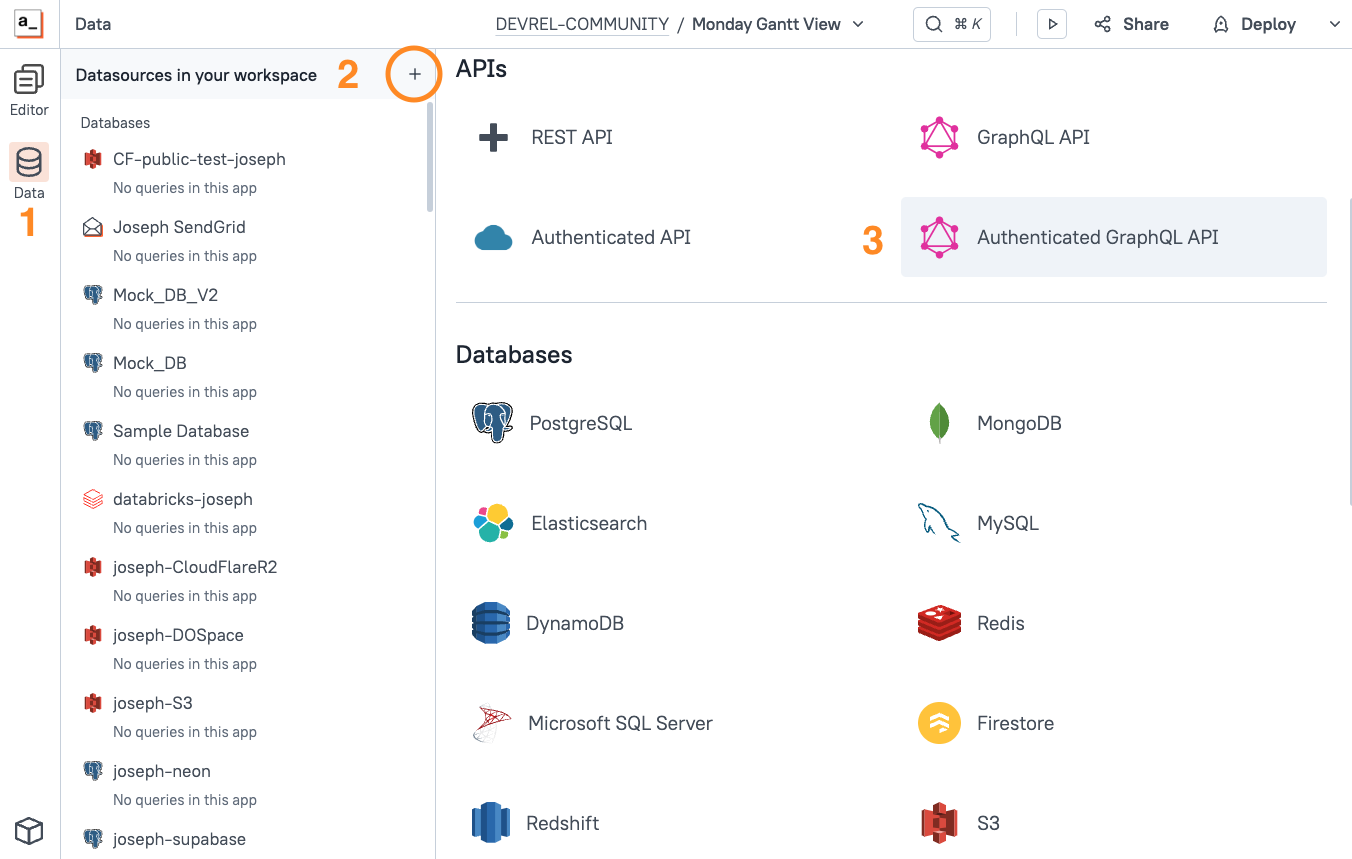
Then configure the Datasource as follows:
| Name | MondayGraphQL |
|---|---|
| URL | https://api.monday.com/v2 |
| Auth Type | Bearer Token |
| Token | YOUR_API_TOKEN |
Save the Datasource. Your token is now securely stored on the Appsmith server and ready to use in your app.
Add New API
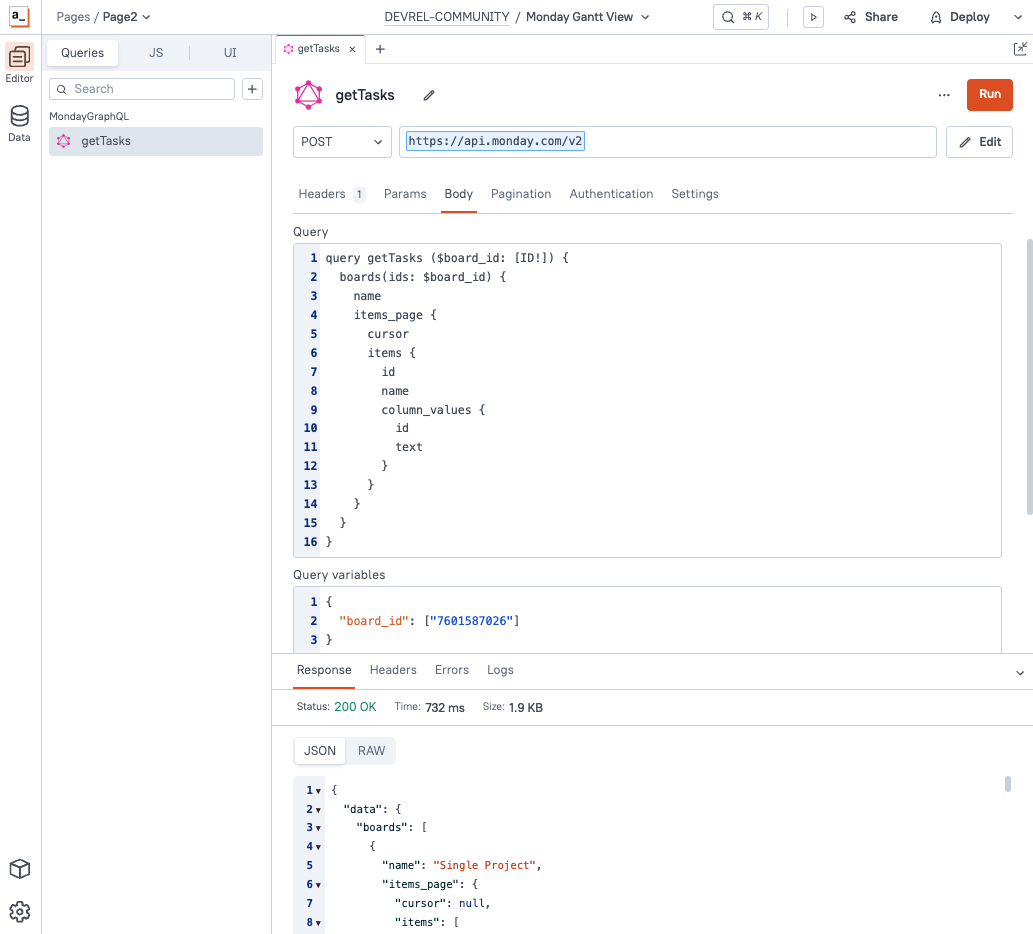
Add a new API under the MondayGraphQL Datasource from the Queries tab on the left pane, and configure it as follows:
| Method | POST |
|---|---|
| Query | Copy from Monday API Playground |
| Query variables | Copy from Monday API Playground |
Click Run and you should get back the same data from the API Playground.
Mermaid Overview
Next, let's take a look at Mermaid.js and their Gantt Charts. Mermaid uses a Markdown-like syntax for generating charts from plain text, without coding. For example, an entity relationship diagram can be created with the following text:
---
title: Order example
---
erDiagram
   CUSTOMER ||--o{ ORDER : places
   ORDER ||--|{ LINE-ITEM : contains
   CUSTOMER }|..|{ DELIVERY-ADDRESS : uses
Which renders as:
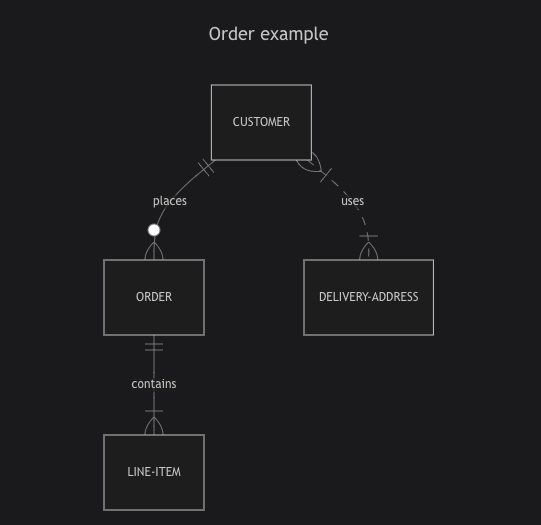
Just import the library, then add the mermaid class to any element and then set its text to a valid mermaid chart config.
Iframe
Now we'll get a basic Mermaid example working in an Iframe widget. You could also use a custom widget if you want to make it interactive, but I'm keeping this example simple and only displaying the Gantt chart.
Drag in an iframe widget and set the SrcDoc to:
<script type="module">
  import mermaid from 'https://cdnjs.cloudflare.com/ajax/libs/mermaid/10.4.0/mermaid.esm.min.mjs';
  mermaid.initialize({startOnLoad: true});
</script>
<div class="mermaid">
  gantt
    title Project Timeline
    dateFormat  YYYY-MM-DD
    section Phase 1
    Task 1  :a1, 2024-10-01, 3d
    Task 2  :after a1, 5d
    section Phase 2
    Task 3  :2024-10-10, 4d
    Task 4  :2024-10-15, 6d
</div>
You should see a chart like this:
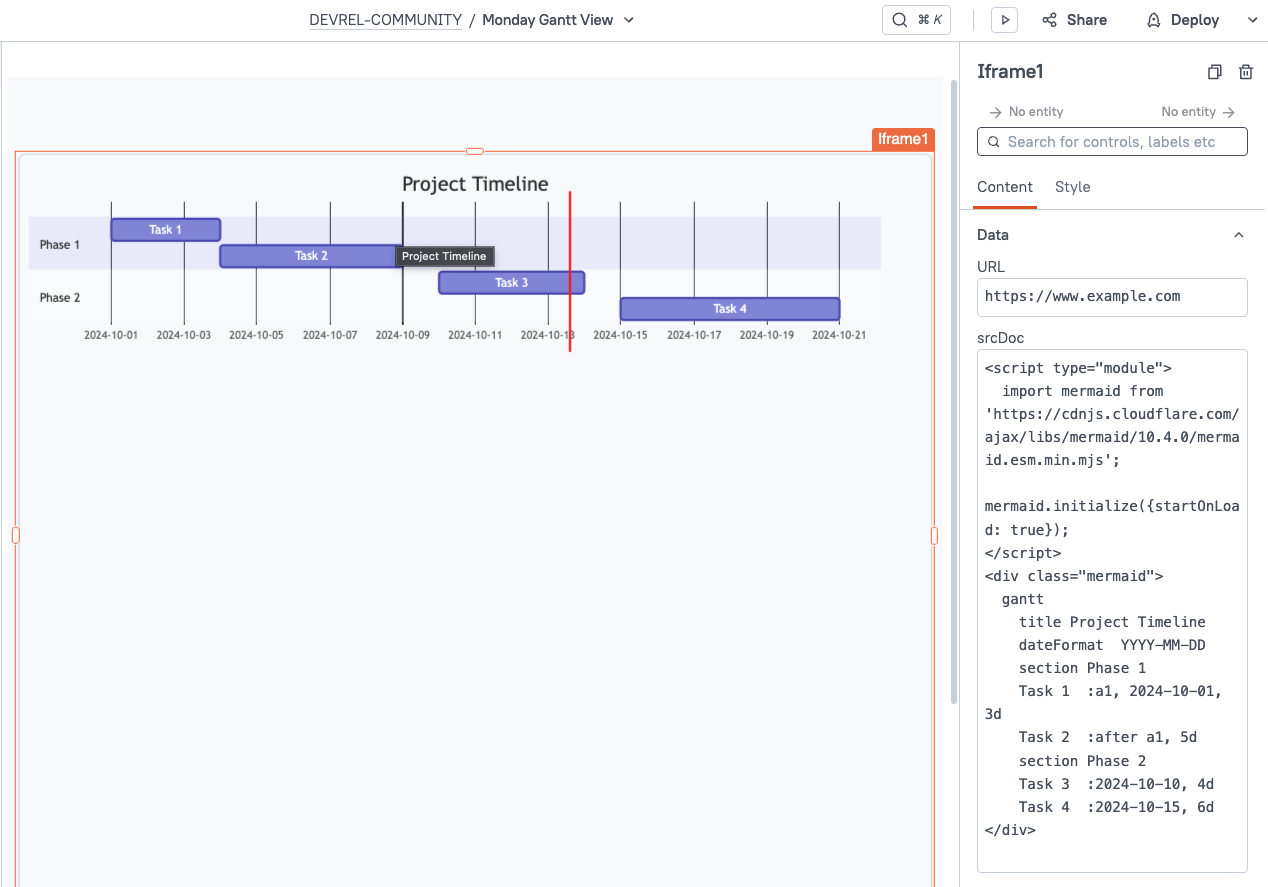
Notice the div with class="mermaid". This is the format that the Monday.com data needs to be converted to before we can insert it dynamically.
Transform Data
Lastly, we'll map over the data from the Monday.com GraphQL API and build up a string in the Mermaid Gantt Chart format.
Add a new JSObject and paste in this function:
export default {

    mapToMermaidGantt: (tasks=getTasks.data.data.boards[0].items_page.items) => {
 let ganttChart = 'gantt\ndateFormat YYYY-MM-DD\n';
 tasks.forEach((task) => {
   const name = task.name;
   const timelineColumn = task.column_values.find(col => col.id === 'project_timeline');
   const status = task.column_values.find(col => col.id === 'project_status').text;

   if (timelineColumn && timelineColumn.text) {
     const [startDate, endDate] = timelineColumn.text.split(' - ');
     ganttChart += `\n${name} : ${status}, ${startDate}, ${endDate}`;
   }
 });
 return ganttChart;
}
}
Run the function, and you should get back a string in the Mermaid Gantt Chart format.
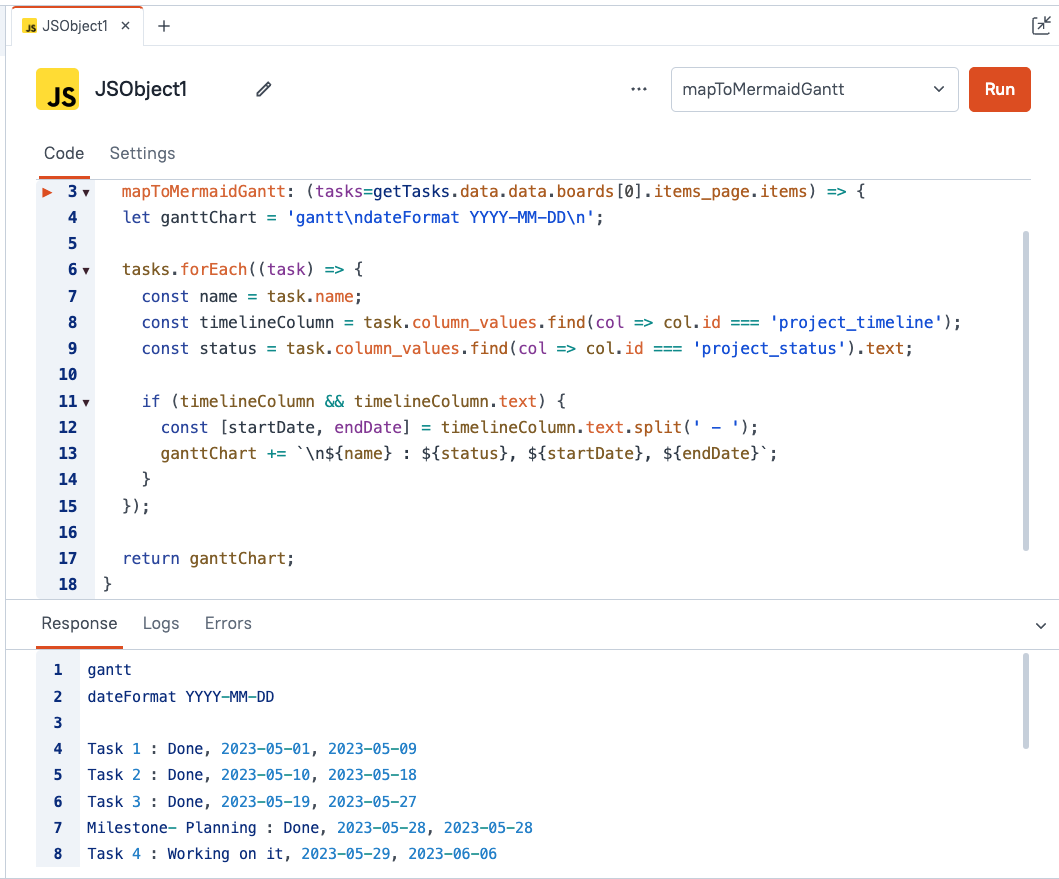
Then update the Iframe ScrDoc to insert this function's output in place of the hard coded chart.
<script type="module">
 import mermaid from 'https://cdnjs.cloudflare.com/ajax/libs/mermaid/10.4.0/mermaid.esm.min.mjs';
 mermaid.initialize({startOnLoad: true});
</script>
<div class="mermaid">
 {{JSObject1.mapToMermaidGantt()}}
</div>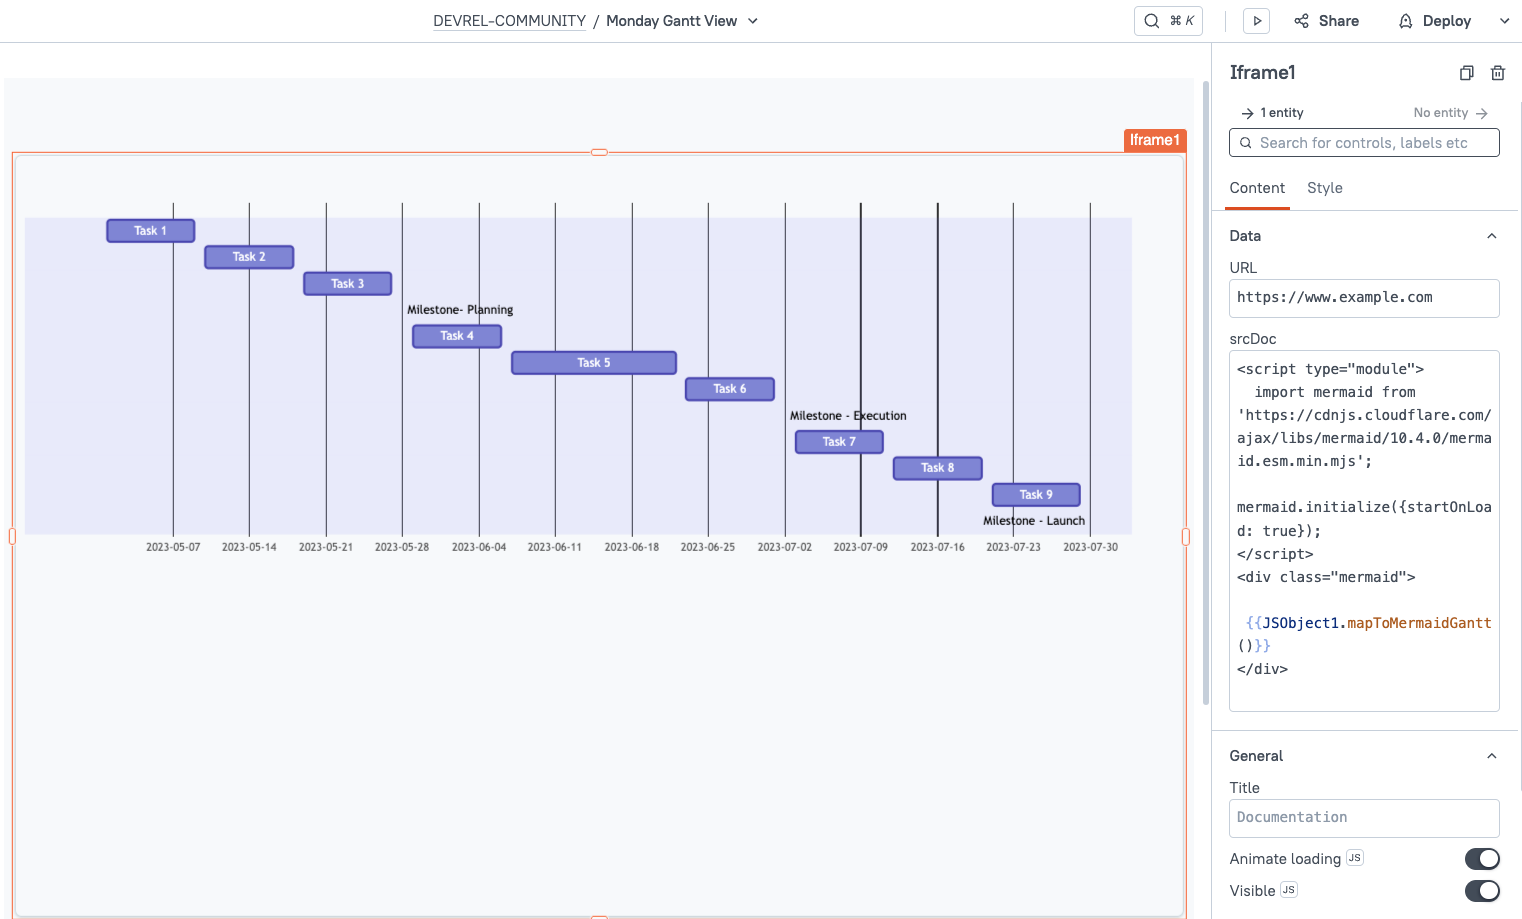
And there it is! A data-driven Gantt Chart from Monday.com's GraphQL API.
Conclusion
Using MermaidJS in an Appsmith Iframe, you can quickly and easily build Gantt Charts and other chart types, using data from any API. By connecting data from Monday.com's GraphQL API, you can build a data-driven Gantt Chart using live data from your Monday account.
What's Next?
From here you could add click interactions, tool tips, color formatting, etc. There are also other libraries like Frappe Gantt that offer more advanced features like dragging to edit. Got an idea for a use case? Drop a comment below!
