

Widgets
Datasources
Baserow Chart Builder
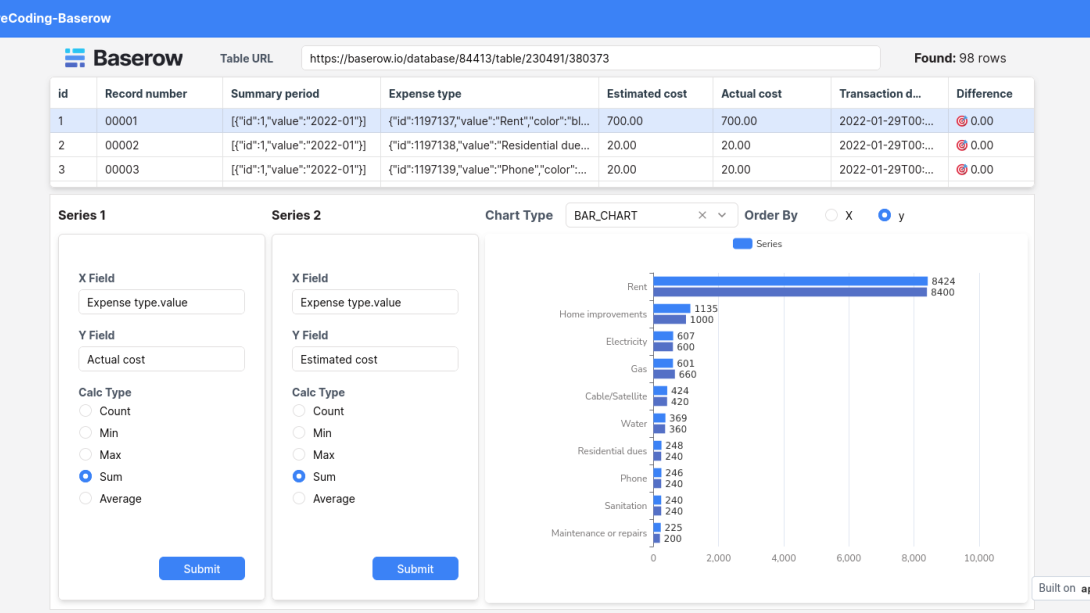
Features
- Chart data from any Baserow table
- Choose a column to group by, and a summary type
- Calculates: count, sum, average, min, and max
- Add multiple series of data using the same function, but with different parameters
This is the template from the December 2023 Live-Coding session, which uses the Baserow API as the backend, and provides a custom JS function to chart data.