

Organizational charts are used to visualize the reporting structure of employees in a tree-like graph. They are usually created with a design tool, and lots of manual data entry. However, most organizations tend to have this same data in a database or spreadsheet format, with a column for the supervisor's name or ID. And with a little JavaScript, this data can be used to create a data-driven org chart that updates itself when the data changes.
In this guide we'll be using data from Airtable's Corporate Organizational Chart template, and generating a chart using the OrgChart JavaScript library. WARNING: This one is gonna get a little JavaScript heavy! However, you can just fork the template and connect your data if you don't want to build this from scratch.
This guide will cover:
- Creating a Personal Access Token in Airtable
- Connecting to Airtable from Appsmith
- Building a Custom Widget that reacts to data updates
- Working with the OrgChart JavaScript library
- Transforming Airtable data with JavaScript
You can copy the Corporate Organizational Chart template from Airtable, or follow along with your own data and adjust the column names as needed to tie in your data. Let's get started!
Create Airtable Access Token
Start out by going to the Airtable's Builder Hub, and select Personal Access Token from the sidebar.
- Create a new token and give it a name
- Add the
data.records:readscope - Under Access, click Add base, and select the Corporate Org Chart base, or any other base you'd like to use with OrgChart
- Click Create Token
You can also add the data.records:write scope if you want to edit data from Appsmith, but this guide will focus on building the org chart, which only requires read access. For more info on building a full CRUD app with Appsmith, check out our other Airtable content here.
Connecting to Airtable from Appsmith
Next, head over to Appsmith and start a new app or open an existing app you want to add the org chart to.
- Click the Data icon on the left sidebar, then click the [+] to add a new Datasource and select Airtable
- Name the Datasource
- Select Personal Access Token, then enter your token and click Save
-
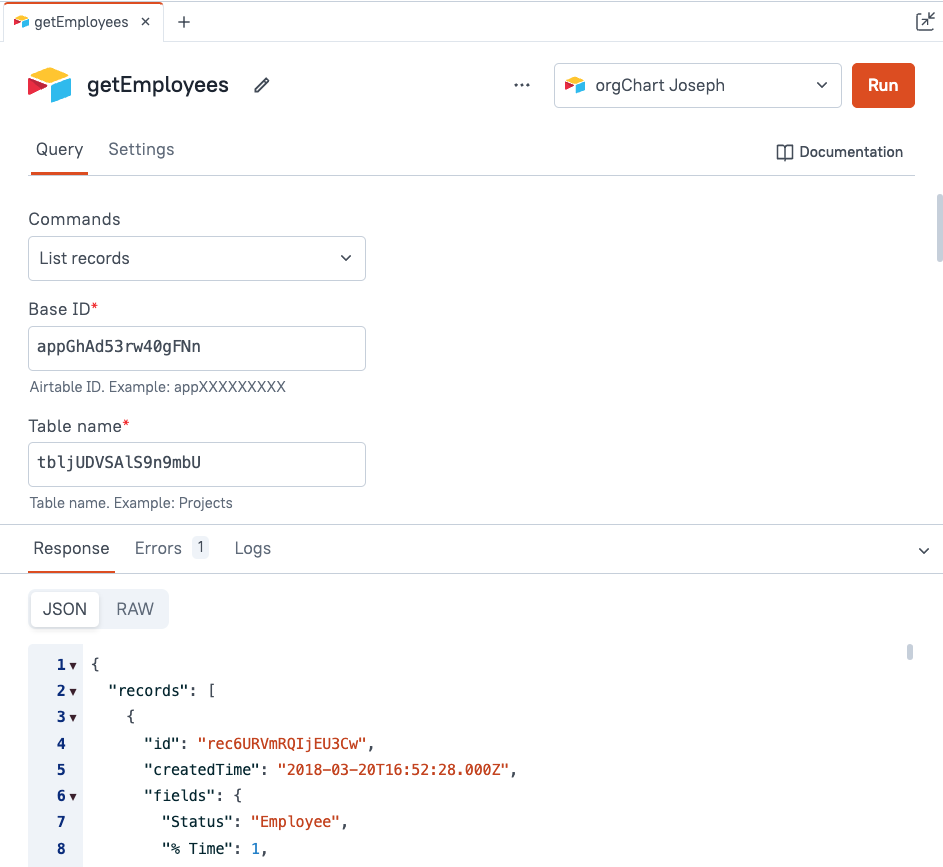
Add a new API under the datasource, with the following settings:
Name getEmployees Command List Records Base ID ID of your Airtable base, from URL (starts with appXXXX)Table name Name of table (Employee directory), or the table ID from URL (starts with tblXXXX)
Click Run, and you should get back a 200 response containing an object with a records array.
Displaying Records in a Table
Notice how each record has an id and a createdTime, then all the other fields are nested in a fields object. This data should be flattened out before displaying in a table.
- Open the JS tab of the left sidebar and add a new JSObject
- Name it AirtableUtils
- Add a function to map over each record and return a new object with a flat data structure
export default {

    flattenData (data=getEmployees.data.records) {
        return data.map(r=>({id:r.id, ...r.fields}))
    }

}
Here we are using an arrow function inside the map to return a new object, and leveraging the spread operator ... to expand the fields object.
Note that the curly braces of the object have to be wrapped in parenthesis so that they are not interpreted as the beginning and end of a multi-line function.
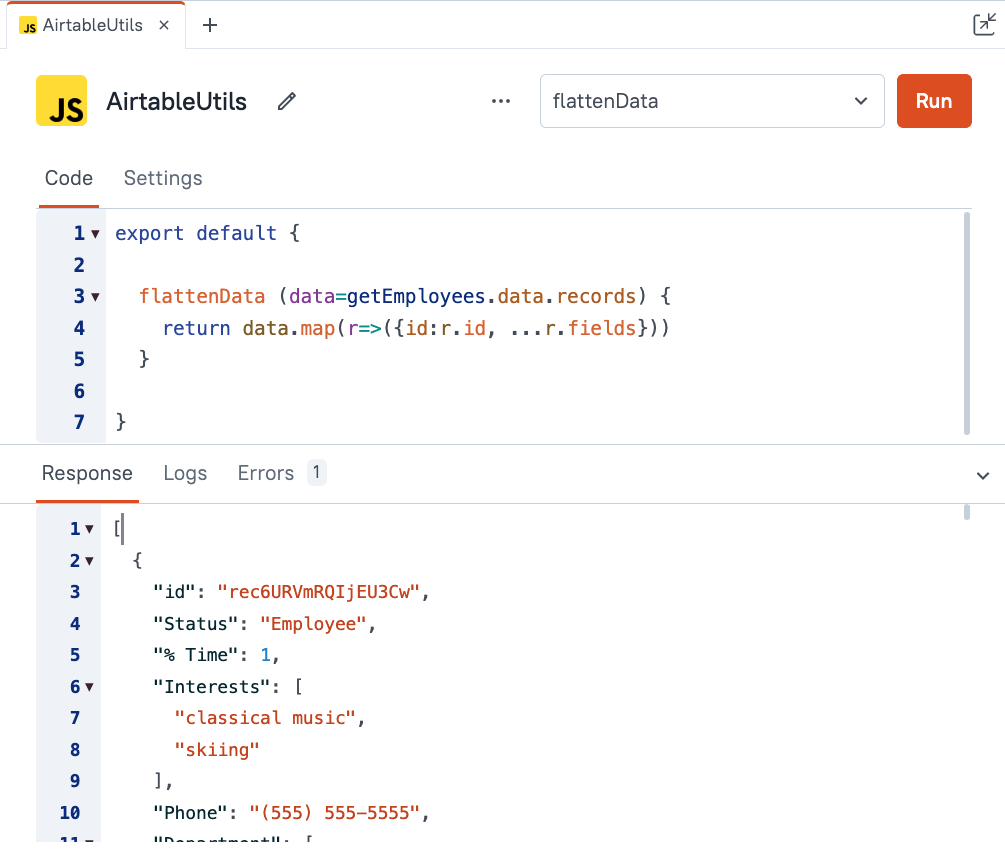
Now each row of data has the ID and other fields flattened for displaying in a table widget.
Select the UI tab, then drag in a new table widget and set the Table data to {{AirtableUtils.flattenData()}}.
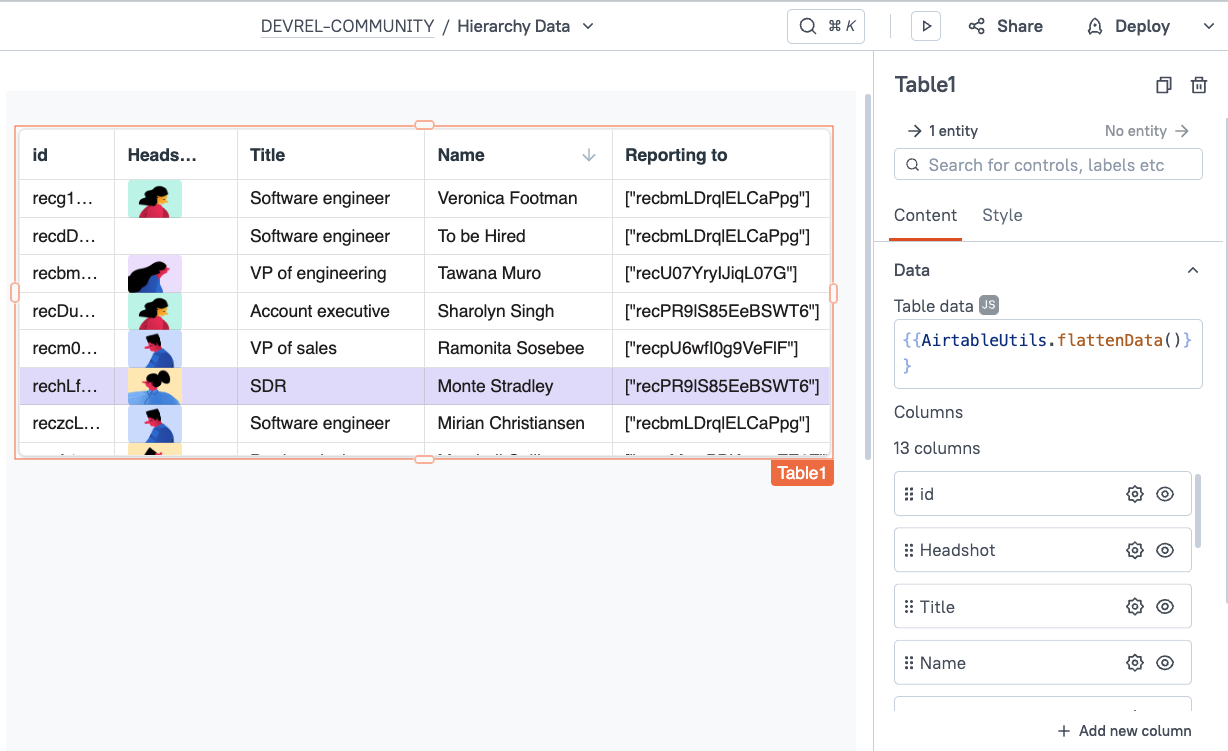
You can also set the Headshot column type to Image, and adjust the Computed value to display the image url. Since some of the images are blank, you'll have to use a ternary operator or other check to avoid an error on the ones that are null.
{{ currentRow["Headshot"] ? currentRow.Headshot[0].url : ''}}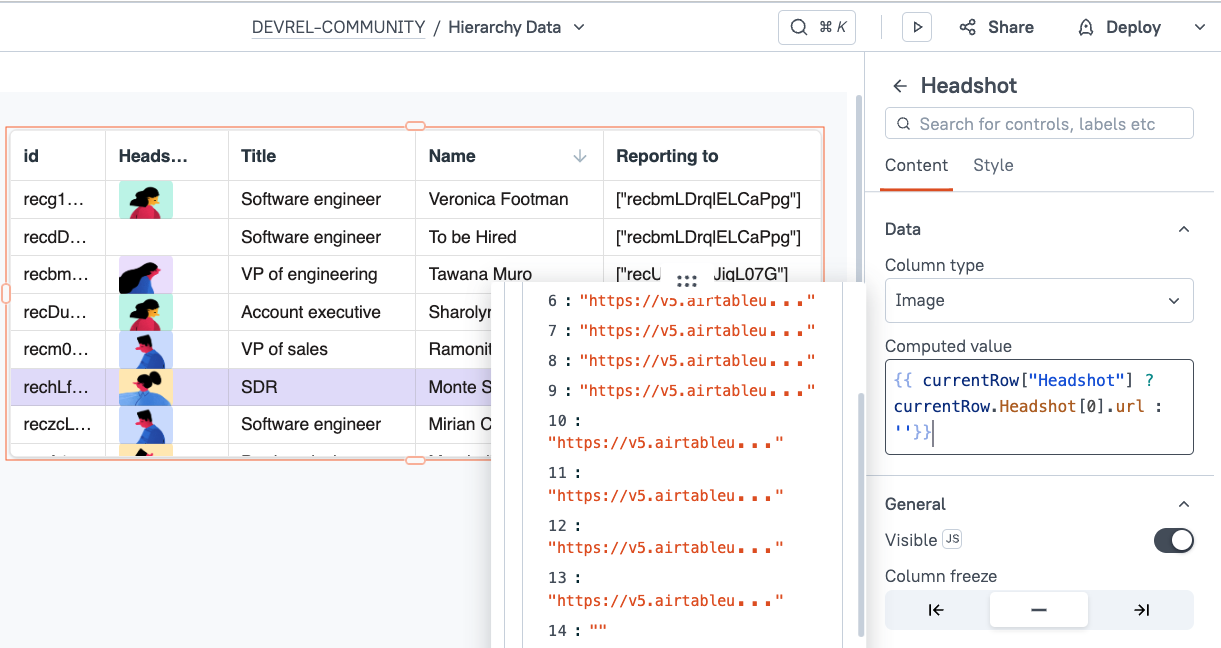
Ok, we have the Airtable data displaying. Time to build that org chart!
Using OrgChart in a Custom Widget
Drag in a custom widget, and then click the Edit source button on the property pane (right side). Then clear out the contents of all 3 tabs of the custom widget editor.
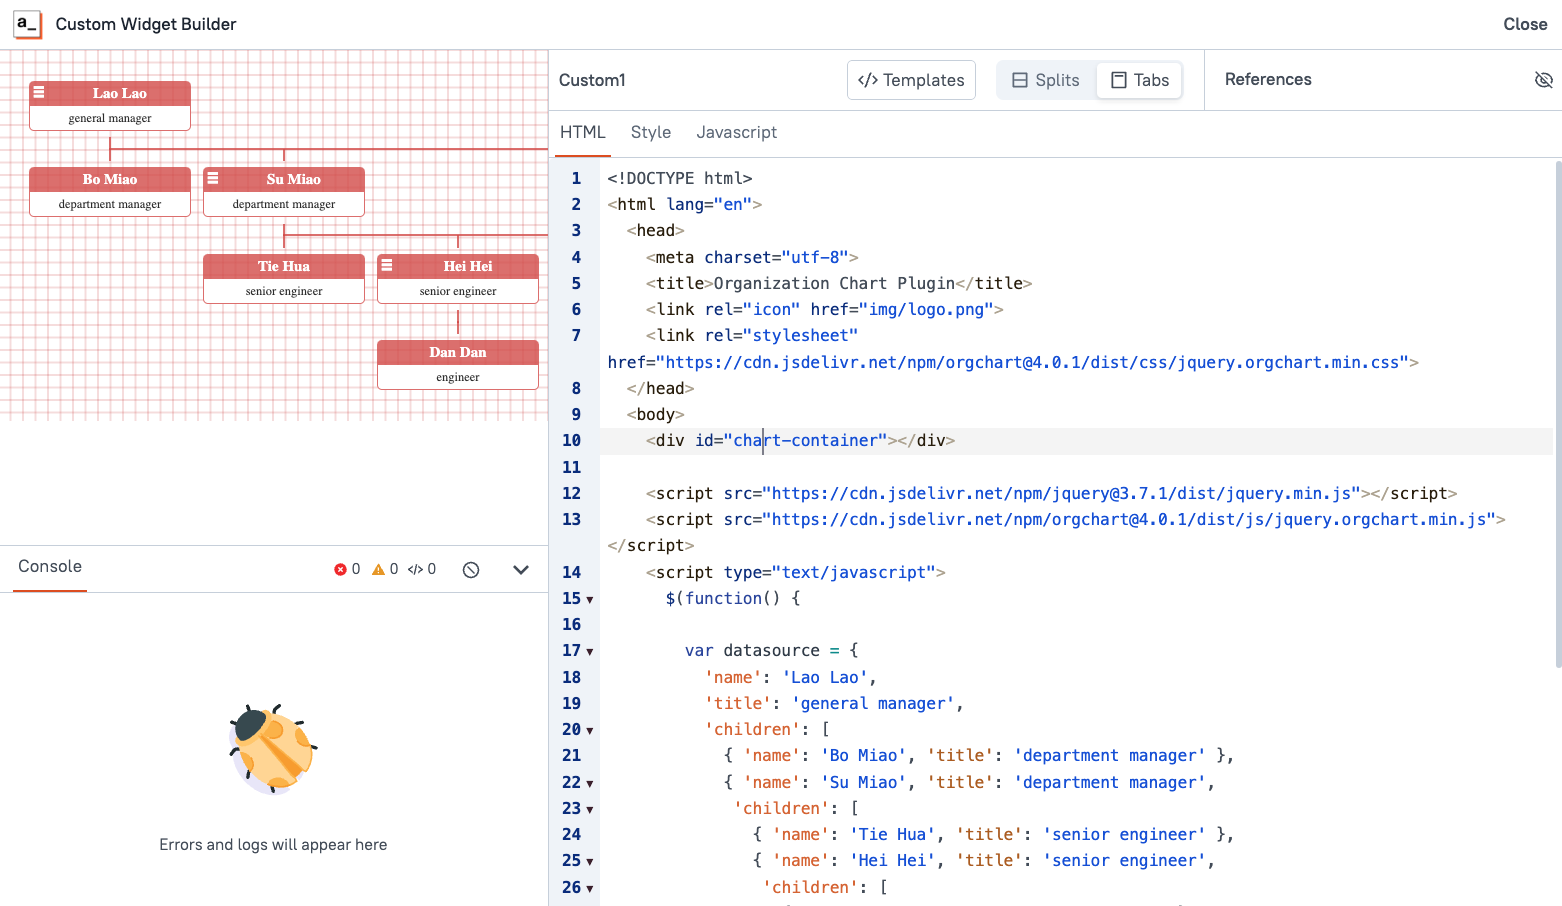
Open the HTML tab, and paste in this example from OrgCharts.
<!DOCTYPE html>
<html lang="en">
    <head>
        <meta charset="utf-8">
        <title>Organization Chart Plugin</title>
        <link rel="icon" href="img/logo.png">
        <link rel="stylesheet" href="https://cdn.jsdelivr.net/npm/orgchart@4.0.1/dist/css/jquery.orgchart.min.css">
    </head>
    <body>
        <div id="chart-container"></div>
        <script src="https://cdn.jsdelivr.net/npm/jquery@3.7.1/dist/jquery.min.js"></script>
        <script src="https://cdn.jsdelivr.net/npm/orgchart@4.0.1/dist/js/jquery.orgchart.min.js"></script>
        <script>
            $(function() {
                var datasource = {
                    'name': 'Lao Lao',
                    'title': 'general manager',
                    'children': [
                        { 'name': 'Bo Miao', 'title': 'department manager' },
                        { 'name': 'Su Miao', 'title': 'department manager',
                         'children': [
                             { 'name': 'Tie Hua', 'title': 'senior engineer' },
                             { 'name': 'Hei Hei', 'title': 'senior engineer',
                                'children': [
                                    { 'name': 'Dan Dan', 'title': 'engineer' }
                                ]
                             },
                             { 'name': 'Pang Pang', 'title': 'senior engineer' }
                         ]
                        },
                        { 'name': 'Hong Miao', 'title': 'department manager' }
                    ]
                };
                $('#chart-container').orgchart({
                    'data' : datasource,
                    'nodeContent': 'title'
                });
            });
        </script>
    </body>
</html>
This should render an org chart loaded with some dummy data.
Note: OrgChart provides a lot of live demo examples, but not a lot of code samples in the docs. Just find an example you want to use, then right click and view source. Then swap out the local links for full CDN url's to import each library. I prefer to use JSDelivr.com but you can use any CDN.
Ok, we have the basic org chart displaying, but this code is not in the best format for use in a custom widget. We should move the JavaScript to the JavaScript tab.
Cut the $(function(){...}) from inside the script tags, and paste it in the JavaScript tab. Then remove the empty <script> tags from the HTML tab.
The custom widget should still be working, but with the JavaScript in the right tab so we can reference data from the Appsmith model.
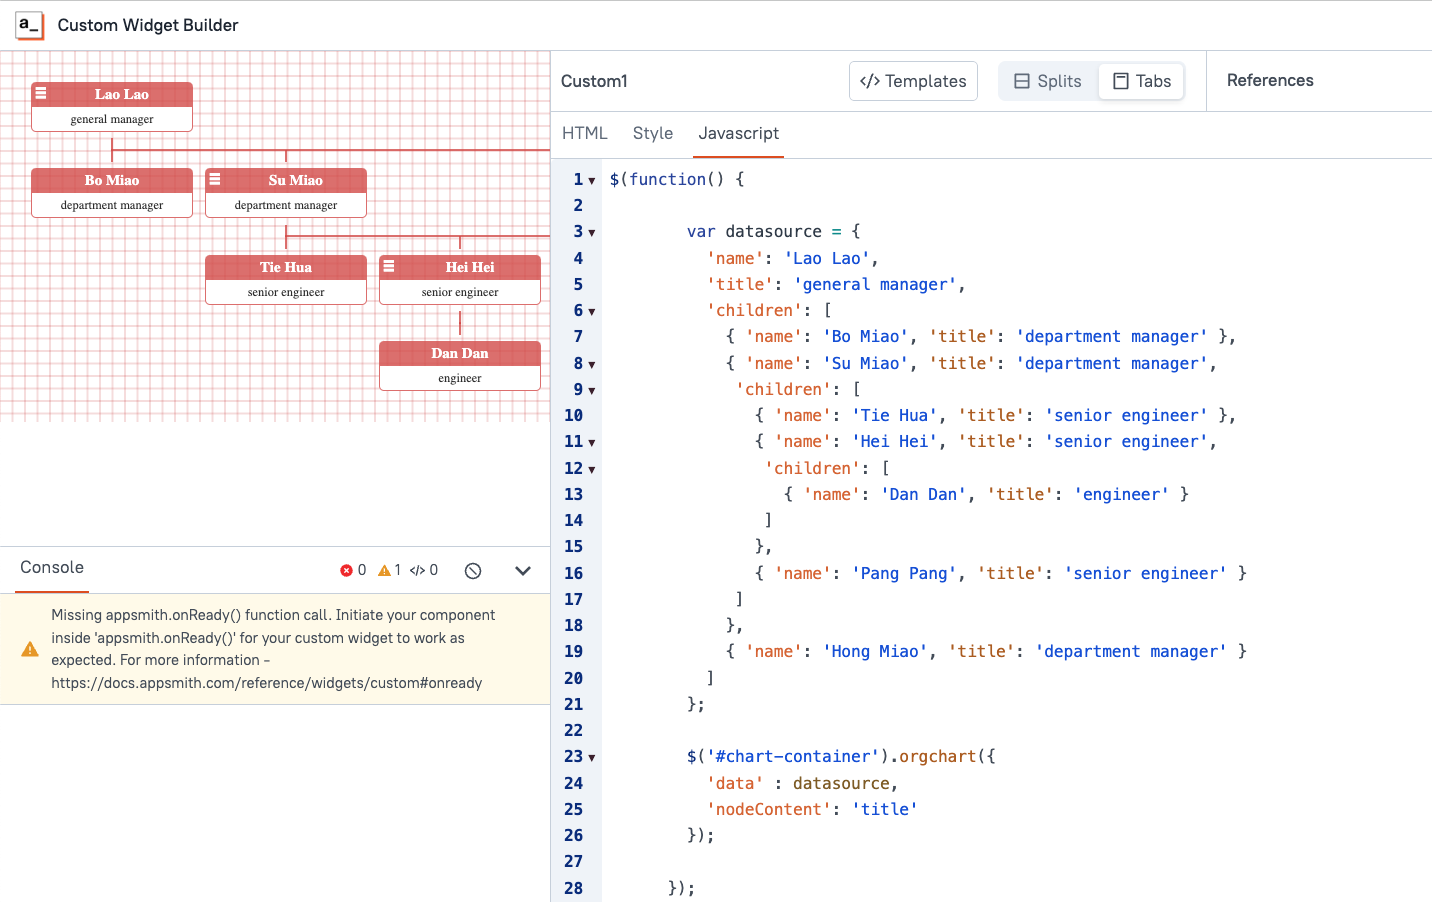
Notice the warning in the console:
Missing appsmith.onReady() function call. Initiate your component inside 'appsmith.onReady()' for your custom widget to work as expected. The code is working, but it won't work if we try to pass in data from Appsmith (outside of the custom widget). The code needs to be wrapped in an Appsmith.onReady() function, so that it will wait for the rest of the Appsmith app to load before rendering the custom widget. This will give the Airtable API time to run and return data before the chart tries to render.
appsmith.onReady(()=>{

    $(function() {
    var datasource = {
        'name': 'Lao Lao',
        'title': 'general manager',
        'children': [
            { 'name': 'Bo Miao', 'title': 'department manager' },
            { 'name': 'Su Miao', 'title': 'department manager',
             'children': [
                 { 'name': 'Tie Hua', 'title': 'senior engineer' },
                 { 'name': 'Hei Hei', 'title': 'senior engineer',
                    'children': [
                        { 'name': 'Dan Dan', 'title': 'engineer' }
                    ]
                 },
                 { 'name': 'Pang Pang', 'title': 'senior engineer' }
             ]
            },
            { 'name': 'Hong Miao', 'title': 'department manager' }
        ]
    };
    $('#chart-container').orgchart({
        'data' : datasource,
        'nodeContent': 'title'
    });
});


})
Most of this code is just the datasource variable, to define the nodes of the chart and their relationship. This is the part we want to make dynamic, and pass in from Airtable.
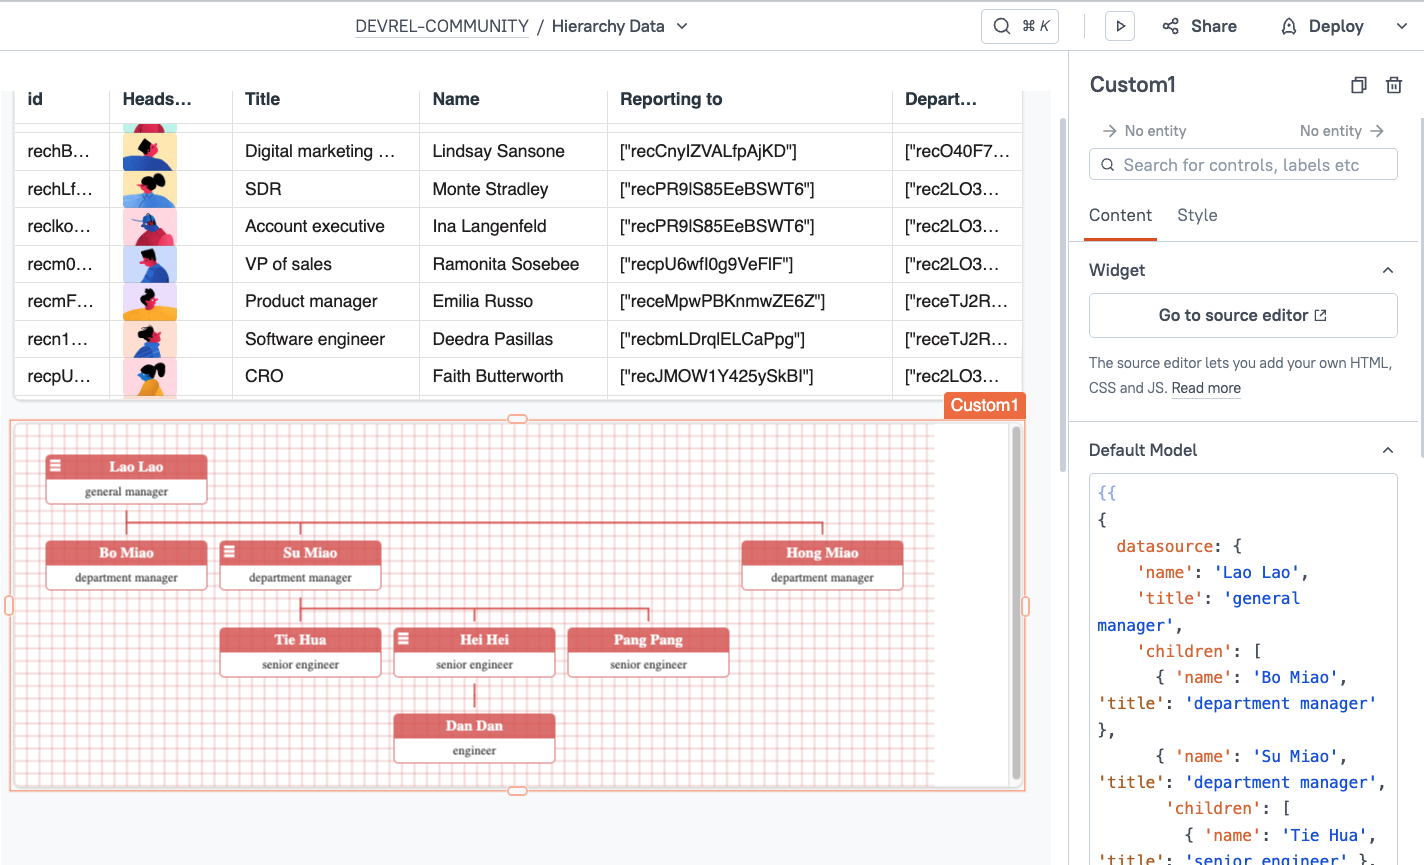
Next, we'll move this datasource variable to the Default model of the custom widget. Just add an object to the model with a datasource property, then paste in the value from the datasource variable.
{{
{
    datasource: {
        'name': 'Lao Lao',
        'title': 'general manager',
        'children': [
            { 'name': 'Bo Miao', 'title': 'department manager' },
            { 'name': 'Su Miao', 'title': 'department manager',
             'children': [
                 { 'name': 'Tie Hua', 'title': 'senior engineer' },
                 { 'name': 'Hei Hei', 'title': 'senior engineer',
                    'children': [
                        { 'name': 'Dan Dan', 'title': 'engineer' }
                    ]
                 },
                 { 'name': 'Pang Pang', 'title': 'senior engineer' }
             ]
            },
            { 'name': 'Hong Miao', 'title': 'department manager' }
        ]
    }
}
}}
Then go back to the Edit source page, and update it to reference the appsmith.model:
appsmith.onReady(()=>{

    $(function() {
    var datasource = appsmith.model.datasource;
    $('#chart-container').orgchart({
        'data' : datasource,
        'nodeContent': 'title'
    });
});

})
The warning should be gone now that you have an appsmith.onReady() function.
Now go back to the main app editor and try updating the model by adjusting an employee name. The chart won't update unless you refresh the page. To make it reactive, we need to add an appsmith.onModelChange() function as well.
//declare chart variable outside onReady/onModelChange
let chart;
appsmith.onReady(()=>{
    $(function() {
        const datasource = appsmith.model.datasource;
        chart = $('#chart-container').orgchart({
            'data' : datasource,
            'nodeContent': 'title'
        });
    });
})
appsmith.onModelChange(function(){
    //avoids error on first load when model is empty
    if(!chart){return}
    //re-initialize, with new data from model
    chart.init({data:appsmith.model.datasource})
})
Now try typing in the Default model again and you should see the chart update in real-time!
Transforming Airtable Data for OrgChart
Ok, we're almost there. Now to format the Airtable data in the expected format for the OrgChart library. This part will require some planning, and the exact approach may be different in your case, based on how your relationship data is stored.
Add a new JSObject and name it OrgChartUtils. This will keep our logic for flattening the Airtable data in a separate file from the OrgChart function that we are going to write to reformat the data.
Speaking of logic, let's break down what this function needs to do, before jumping straight to the code.
The OrgChart library expects the data in the format:
{
     'name': 'Lao Lao',
     'title': 'general manager',
     'children': [
       { 'name': 'Bo Miao', 'title': 'department manager' },
       { 'name': 'Su Miao', 'title': 'department manager',
         'children': [
           { 'name': 'Tie Hua', 'title': 'senior engineer' },
           { 'name': 'Hei Hei', 'title': 'senior engineer',
             'children': [
               { 'name': 'Dan Dan', 'title': 'engineer' }
             ]
           },
           { 'name': 'Pang Pang', 'title': 'senior engineer' }
         ]
       },
       { 'name': 'Hong Miao', 'title': 'department manager' }
     ]
   }
But our Airtable data, after flattening, is in the format:
[
 {
   "id": "rec6URVmRQIjEU3Cw",
   "Status": "Employee",
   "Reporting to": [
     "recJMOW1Y425ySkBI"
   ],
   "Birthday": "1991-03-01",
   "Email": "hazel@example.com",
   "Title": "CMO",
   "Name": "Hazel Spillers"
 }. //,...
]
So we'll have to loop through the array of employees from Airtable, and construct an object with the CEO at the top, and nested arrays of children at multiple levels, based on the Reporting to field. For each employee, we will need to find all of the child records and add them to the children array. This could be done with nested loops, but that wouldn't be great for performance. Instead we can do two separate loops that each run once.
Loop 1 - Build a Nodes Object
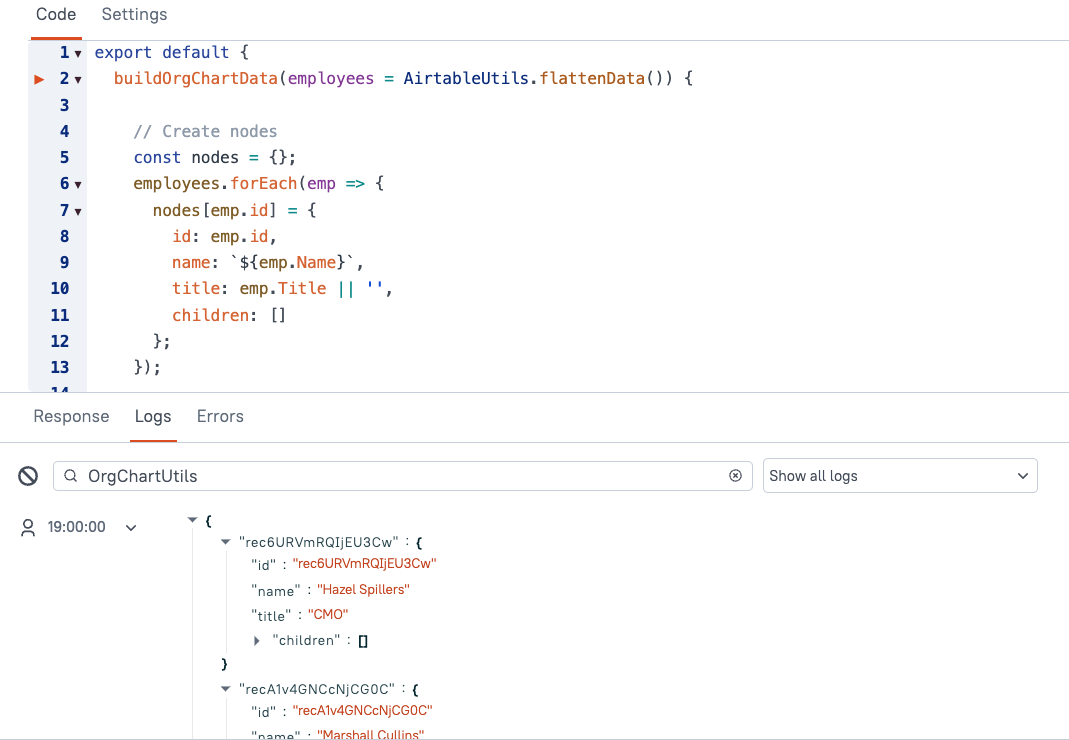
Convert the array to an object, with nodes matching the record ID's. This way we can access the records by their IDs directly, instead of having nested loops with a find or filter loop for each employee. We'll also add in a placeholder children array during this loop, so that the next loop can push employees to the correct children array. This will need an empty object declared at the start, then new nodes will be added to it during the loop.
        // Create nodes
        const nodes = {};
        employees.forEach(emp => {
            nodes[emp.id] = {
                id: emp.id,
                name: `${emp.Name}`,
                title: emp.Title || '',
                children: []
            };
        });
The nodes object will allow us to access any employee record by its ID using bracket notation.
Loop 2 - Build the Tree From Nodes
Loop over the array from Airtable again, and use the nodes object from the first loop to access the correct employee and push the current employee to the children array for the respective supervisor. If there is no supervisor ID, treat as a top-level, or root node.
// Build the tree
const roots = [];
employees.forEach(emp => {
const node = nodes[emp.id];
const supv_id = emp['Reporting to']; //array or null
// Check if employee has a supervisor and that supervisor exists in nodes
if (!!supv_id && nodes[supv_id[0]]) {
nodes[emp['Reporting to'][0]].children.push(node);
} else {
// If no supervisor, treat as a root-level employee
roots.push(node);
}
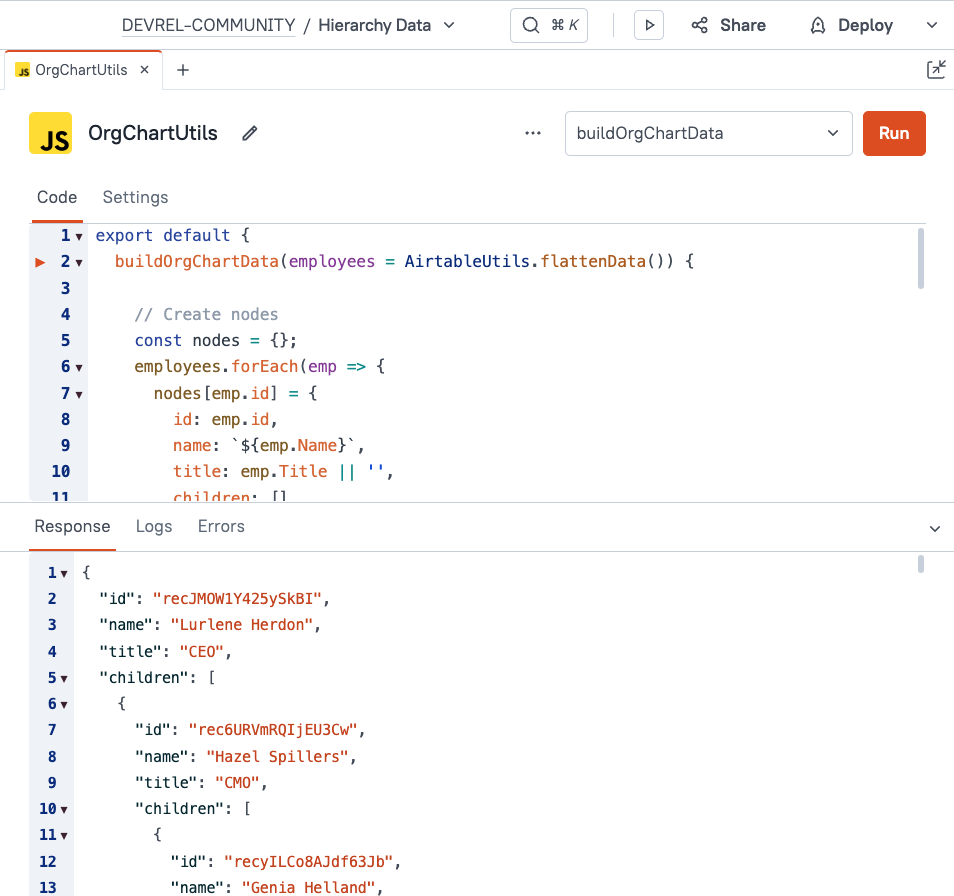
});Returning the OrgChart Datasource
Lastly, add a return statement for the root node. If there is only one top level employee, then they can be the root node. But if there are more than one employees at the top, we'll want to add a 'company' node for the top level so OrgChart can render it properly.
        // Handle multiple roots or a single root
        if (roots.length === 1) {
            return roots[0]; // Return single root employee
        } else {
            // If there are multiple root-level employees, create a 'Company' root
            return {
                id: 'root',
                name: 'Company',
                title: '',
                children: roots
            };
        }
Connecting Airtable Data to OrgChart
And now for the moment of truth! 🫣
We've already tested that the OrgChart custom widget works with hardcoded data, and that the chart updates when the data changes. So in theory...
Just replace the sample data in the Default model with the return value from our new buildOrgChartData() function:
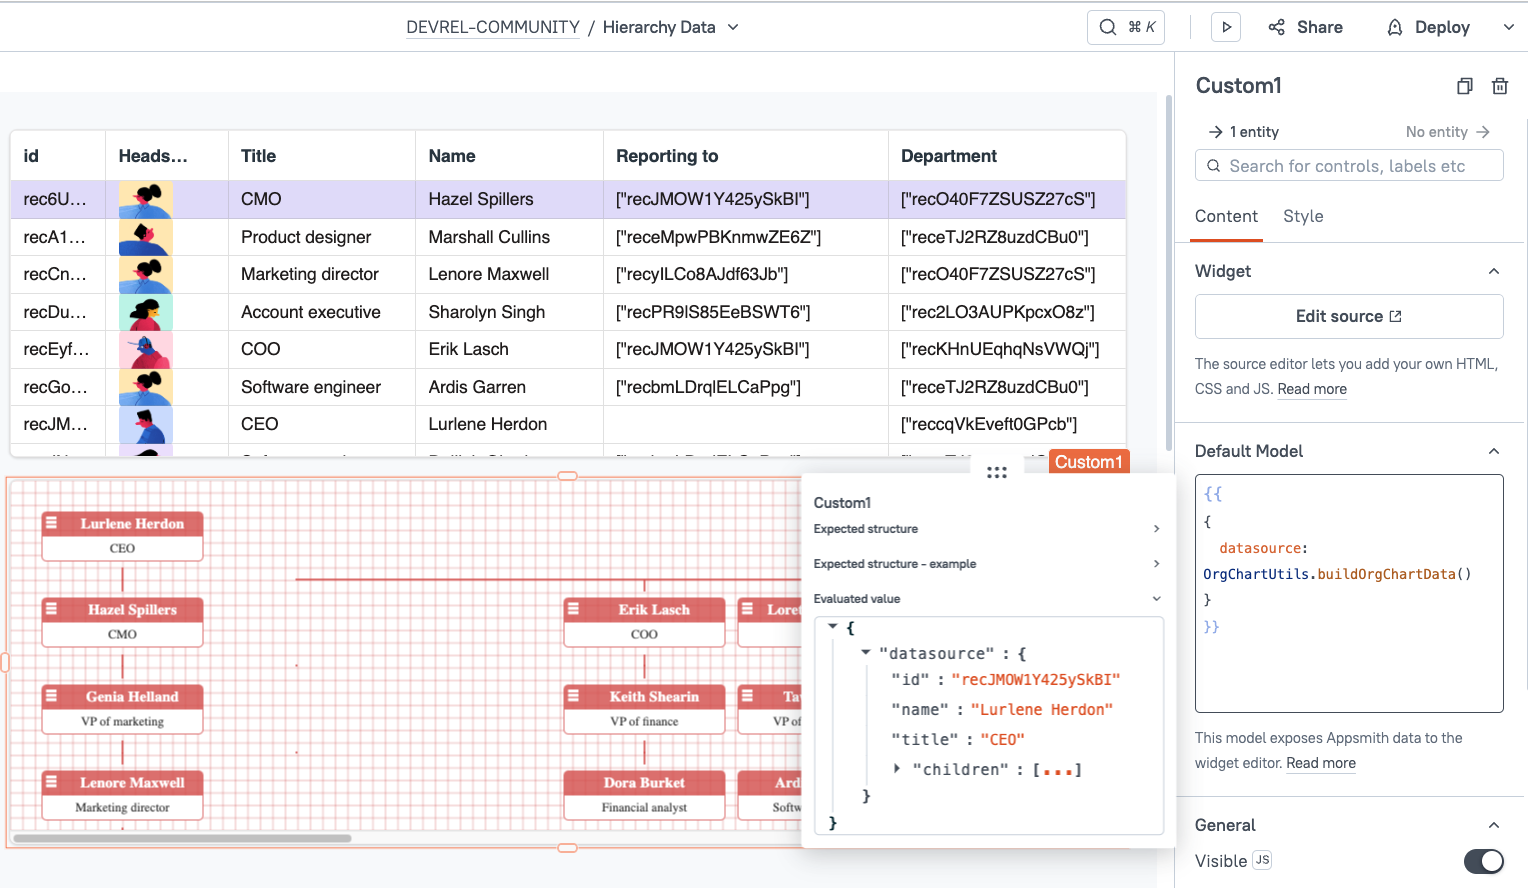
It Works! Now head back to Airtable and change the CEO's name to yours. Re-run the getEmployees query and you should see your name at the top of the chart! Congrats on the promotion! 🤝

Conclusion
Organizational Charts are useful for visualizing a reporting structure, but keeping them updated manually can be a lot of work. This work can be automated by creating a data-driven chart using the OrgChart library in an Appsmith custom widget, allowing you to chart data from Airtable or any other API or database.
What's Next?
OrgChart has tons of different options to customize the display and interactions, like adding pan and zoom features, or icons and extra css classes to add styling. You could also add click events to each node with a card view or navigate to the employee record in detail view. Got an idea for other use cases? Drop a comment below!