

Tracking Your OpenAI API Costs: From Hidden Endpoint to Custom App
Goal
To build a custom usage dashboard and reporting tool for OpenAI. This app is also available as a community template.
Prerequisites
OpenAI account and API keys
Appsmith account
A curious nature
Overview
Hello fellow developers and AI nerds! Today, I'm going to talk to you about my recent adventure into the API underworld of OpenAI. The gold we sought? A way to track the API usage costs of specific secret keys across various models.
In my quest to build an automated tool for generating mock data using OpenAI's APIs, I had to decipher this hidden knowledge. No, it wasn't a quest like Indiana Jones seeking the Holy Grail, but it sure felt like it sometimes. I aimed to understand not just the charge to run the product, but also the impact of specific token counts on the prompts used in the app. If you're anything like me, you're probably thinking, "No sweat, I'll just dive into the OpenAI docs and find what I need." Well, dear reader, that's where our journey takes an unexpected turn. Let's find out hot to track your openAI API cost.
Discovery of the Undocumented Endpoint
To my surprise, and perhaps a pinch of dismay, no documentation or endpoint pointed me towards this much-needed data. It was like embarking on a quest without a map. My initial hopes of a quick find were dashed. So, I did what any intrepid developer would do – I rolled up my sleeves and plunged into the vast, unruly wilds of the internet.
As my search raged on, I stumbled upon a forum post - a beacon in the dark, if you will. A quick side note here: developers and forums go together like bugs and duct tape – essential for survival but not exactly something you look forward to dealing with. But I digress.
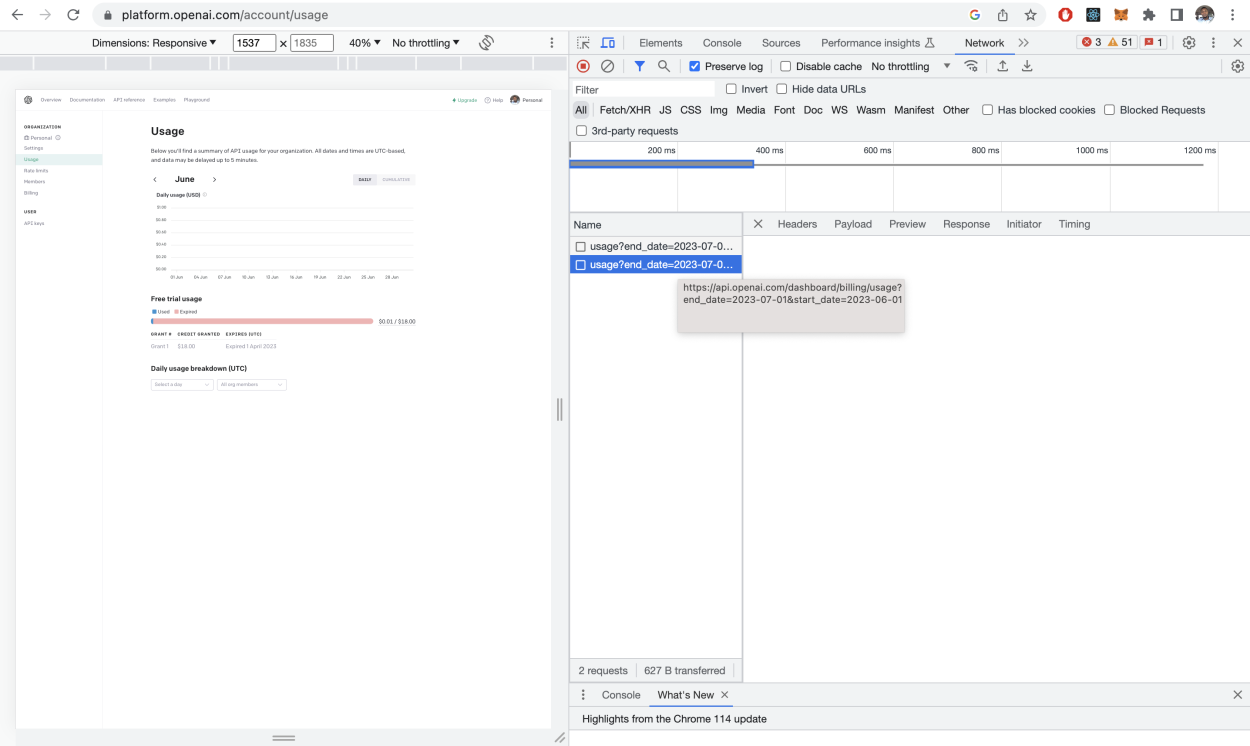
The forum post revealed the Holy Grail – the OpenAI usage page: https://platform.openai.com/account/usage. Even better, a deep inspection of the Chrome console's network tab pointed out an API call to a mysterious endpoint – https://api.openai.com/v1/dashboard/billing/usage?start_date=2023-05-01&end_date=2023-07-03. This sneaky endpoint was missing from the official docs like an easter egg in a video game, waiting to be discovered by those brave enough to venture off the beaten path.
So, my fellow developers, heed this tale: the Console is your friend, and the Network tab, your trusty steed. Together, they can uncover a treasure trove of secrets, leading you to solutions you didn't even know existed.
Unlocking the Endpoint's Secrets
Once I got my hands on the key, I had to figure out how it worked. Through trial and error (and maybe a little bit of programmer’s intuition), I began to coax the data I needed from it.
I created two different secret keys, used them in different test cases, and managed to track the cost and efficiency of specific models to get the precise answer needed for a particular prompt. And it was glorious!
From Secrets to Dashboard
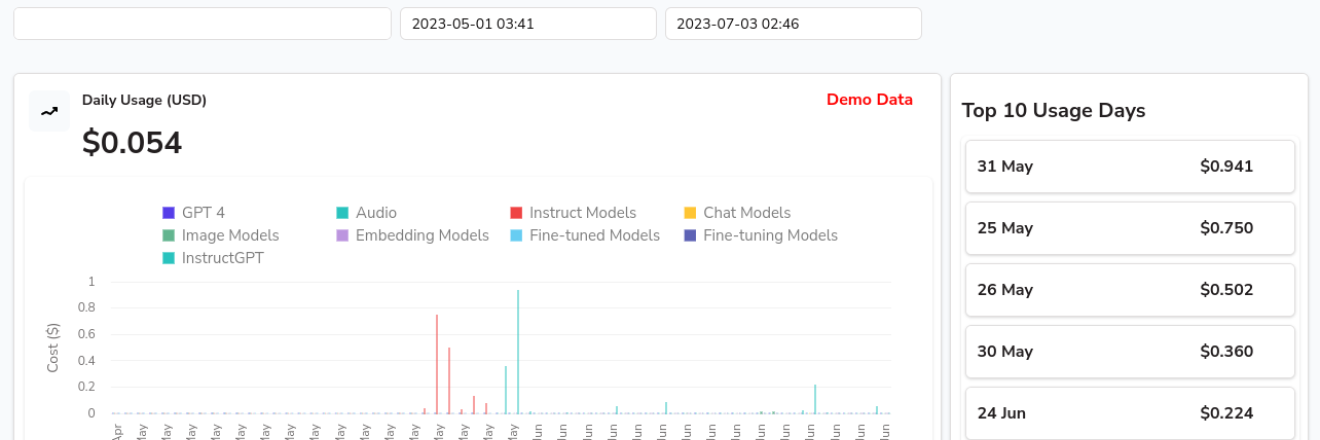
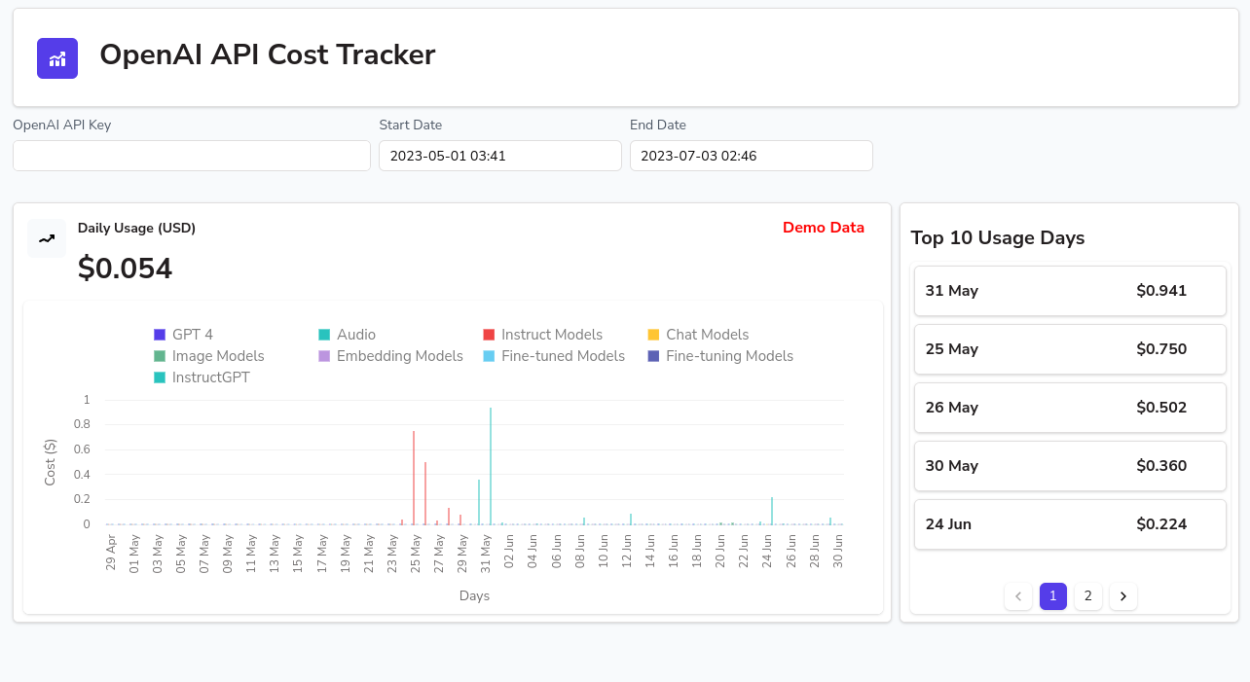
Buoyed by this exciting discovery, I decided to make my triumph accessible to everyone. So, I ventured into the lands of Appsmith and constructed a handy dashboard. This dashboard gobbles up your OpenAI token and regurgitates a neat report showing the cost trend per period for all models, the top spending days, and the daily cost.
Here's how I summoned this useful beast:
Add the datasource
In Appsmith, create a new app and add a new REST datasource. The API endpoint is
https://api.openai.com/v1/dashboard/billing/usage.Start and end dates
Add two
Datepickerwidgets for the start and end dates. I also crafted a function to validate these dates, ensuring they're at most 100 days apart and the end date never precedes the start date:validateDates: () => { // Parsing the date strings into date objects const startDate = new Date(dat_startDate.formattedDate); const endDate = new Date(dat_endDate.formattedDate); // Checking if the end date is before or the same as the start date if (endDate <= startDate) { showAlert('The end date should be after the start date.', 'error'); return false; } // Checking if the difference between the dates is more than 100 days const diffTime = Math.abs(endDate - startDate); const diffDays = Math.ceil(diffTime / (1000 * 60 * 60 * 24)); // Convert milliseconds to days if (diffDays > 100) { showAlert('The number of days between the start and end date should not be more than 100 days.', 'error'); return false; } // If all validations pass return true; }Pass date range to API call
The next step was to link this slick UI with the query and fetch all the data. You will want the start and end dates to be passed as parameters to the endpoint you set up so that they are passed through like this:
https://api.openai.com/v1/dashboard/billing/usage?start_date=2023-05-01&end_date=2023-07-03Format data response
I then penned a nifty JS function to group the data by the models. This allows us to gaze upon the cost for each model daily for the selected period.
groupCostsByModel: async () => {
		const cost = await this.getUsageData() // function to return cost data from api
		const dailyCosts = cost.daily_costs;
		// Create an empty object to hold the result
		let costsByModel = {};

		// Iterate over each day's costs
		dailyCosts.forEach(day => {
			// Convert the timestamp to a date string in 'YYYY-MM-DD' format
			const date = new Date(day.timestamp * 1000);
			let year = date.getFullYear();
			let month = (date.getMonth() + 1).toString().padStart(2, '0');
			let dayString = date.getDate().toString().padStart(2, '0');
			const dateString = `${year}-${month}-${dayString}`;

			// Iterate over each line item in the day's costs
			day.line_items.forEach(item => {
				// If this model hasn't been seen yet, add it to the result object
				if (!costsByModel.hasOwnProperty(item.name)) {
					costsByModel[item.name] = [];
				}

				// Add the cost for this day to this model's costs
				costsByModel[item.name].push({ date: this.convertDate(dateString), cost: item.cost / 1000 });
			});
		});

		return costsByModel;
	}
Calculate daily average and highest spend
Then, I set up two more functions: one for finding the dailyAverageCost and another for pinpointing the top 10 days with the highest spend.
dailyAverageCost: async () => {
		const cost = await this.getUsageData() // function to return cost data from api
		const dailyCosts = cost.daily_costs;
		// Initialize total cost
		let totalCost = 0;

		// Loop over each day's costs
		dailyCosts.forEach(day => {
			// Loop over each line item in the day's costs
			day.line_items.forEach(item => {
				// Add the cost for this item to the total cost
				totalCost += item.cost;
			});
		});

		// Divide total cost by the number of days to get the average
		const averageDailyCost = totalCost / dailyCosts.length;

		return (averageDailyCost / 1000).toFixed(3);
	},

	daysWithHighestSpend: async () => {
		const cost = await this.getUsageData() // function to return cost data from api
		const dailyCosts = cost.daily_costs;
		// Map each day to an object with the date and total cost
		let daysWithTotalCosts = dailyCosts.map(day => {
			// Convert the timestamp to a date string in 'YYYY-MM-DD' format
			const date = new Date(day.timestamp * 1000);
			let year = date.getFullYear();
			let month = (date.getMonth() + 1).toString().padStart(2, '0');
			let dayString = date.getDate().toString().padStart(2, '0');
			const dateString = `${year}-${month}-${dayString}`;

			// Calculate the total cost for the day
			let totalCost = day.line_items.reduce((sum, item) => sum + item.cost, 0);

			return { date: this.convertDate(dateString), totalCost: (totalCost / 1000).toFixed(3) };
		});

		// Sort the days by total cost in descending order
		daysWithTotalCosts.sort((a, b) => b.totalCost - a.totalCost);

		// Return the top 10 days
		return daysWithTotalCosts.slice(0, 10);
	},
Season to taste
You will want to add in the chart and list widgets, and style to your liking. You can also fork the app directly if you don't want to mess about with that.
Conclusion
The Appsmith Advantage
Crafting this app on Appsmith was 2 hours well spent. Thanks to Appsmith's robust features, a single API endpoint, and a handful of utility functions, I could spin up a front end and bake in the logic necessary for this application.
That, dear reader, is the tale of how an undocumented OpenAI endpoint was unearthed and harnessed to construct a handy API cost tracker on Appsmith. Remember, as adventurers in the tech world, the treasures we seek often lie off the beaten path, beyond the reaches of the map. The right tools, such as Appsmith, empower us to turn these hidden gems into practical tools for everyone.
Feeling the itch to start your own app-building adventure? Head over to Appsmith to kickstart your journey. Fancy taking a closer look at the API cost tracker in action? Check it out here. Both seasoned and budding developers alike will find Appsmith's intuitive design and powerful features the perfect companion for their software adventures.
Until next time, may your codes run error-free, your apps be intuitive, and your endpoints always return 200. Happy app-building!


The way you turned raw data into a polished Appsmith dashboard is super inspiring. It’s kind of like designing a custom level in Geometry Dash Lite — simple tools, but with the right creativity, you can build something amazing. Thanks for documenting the validation logic too — the date-check function alone is a solid reference for any dev dealing with user input.